select the correct answer. which graph represents the solution to the inequality? -2.4(x - 6) ≥ 52.8
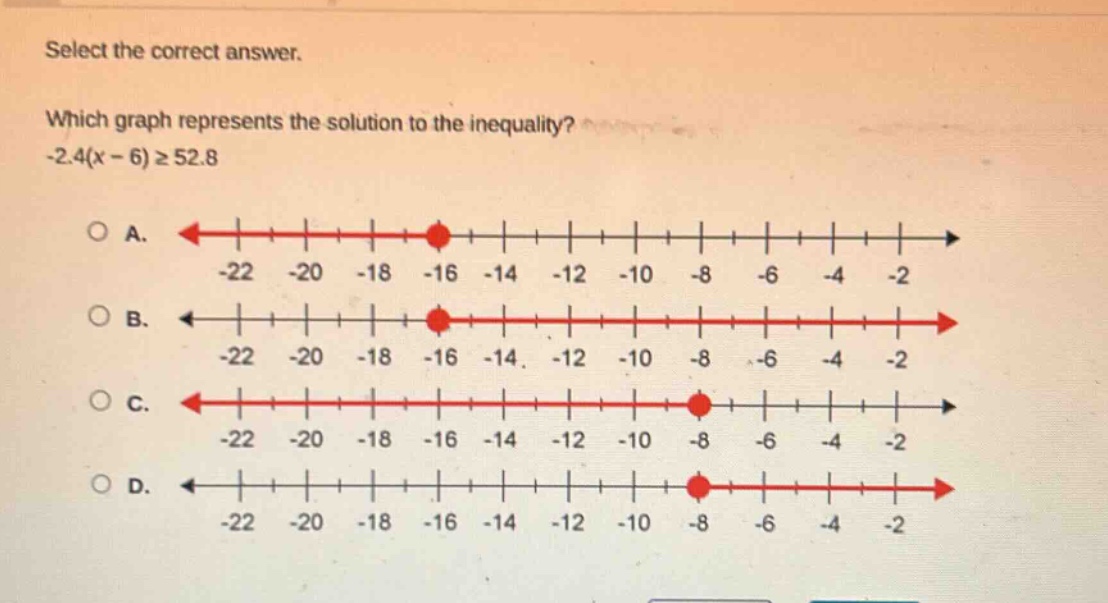
select the correct answer. which graph represents the solution to the inequality? -2.4(x - 6) ≥ 52.8
Answer
Answer:
A.
Explanation:
Step1: Expand the left - hand side
$-2.4(x - 6)=-2.4x+14.4$ So the inequality becomes $-2.4x + 14.4\geq52.8$.
Step2: Subtract 14.4 from both sides
$-2.4x\geq52.8 - 14.4$ $-2.4x\geq38.4$
Step3: Divide both sides by - 2.4 and reverse the inequality sign
$x\leq\frac{38.4}{-2.4}$ $x\leq - 16$ The graph of $x\leq - 16$ has a closed - circle at $x = - 16$ and the arrow points to the left, which is represented by option A.