a small dairy farm writes a business plan. it includes a graph showing the estimated amount of feed used…
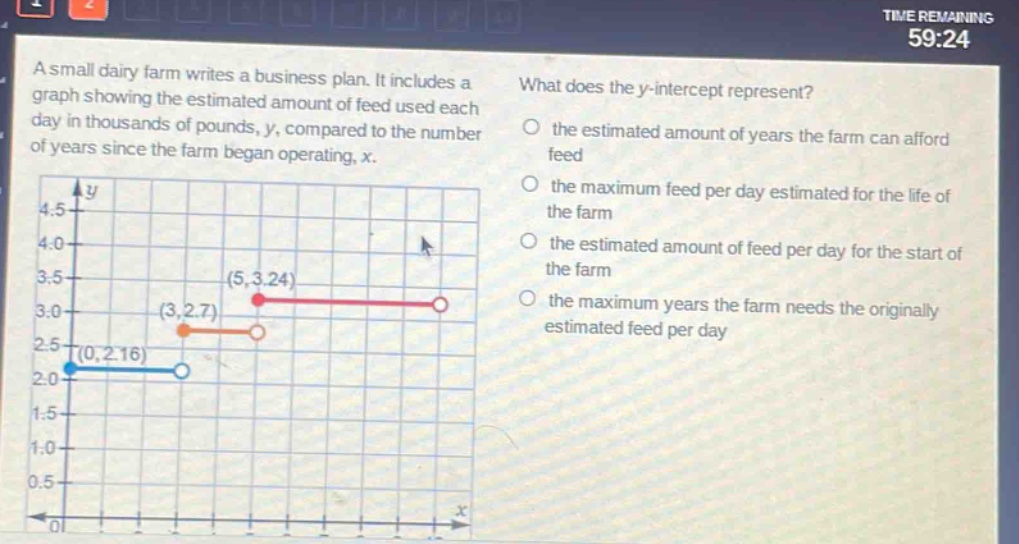
a small dairy farm writes a business plan. it includes a graph showing the estimated amount of feed used each day in thousands of pounds, y, compared to the number of years since the farm began operating, x. what does the y - intercept represent? the estimated amount of years the farm can afford feed the maximum feed per day estimated for the life of the farm the estimated amount of feed per day for the start of the farm the maximum years the farm needs the originally estimated feed per day
Answer
Brief Explanations:
The y-intercept occurs at ( x = 0 ), which represents the starting point (0 years since the farm began operating). In the context of the graph, ( y ) measures the estimated daily feed in thousands of pounds, so the y-intercept specifically denotes the feed amount at the start.
Answer:
the estimated amount of feed per day for the start of the farm