the sugar sweet company needs to transport sugar to market. the graph below shows the transporting cost (in…
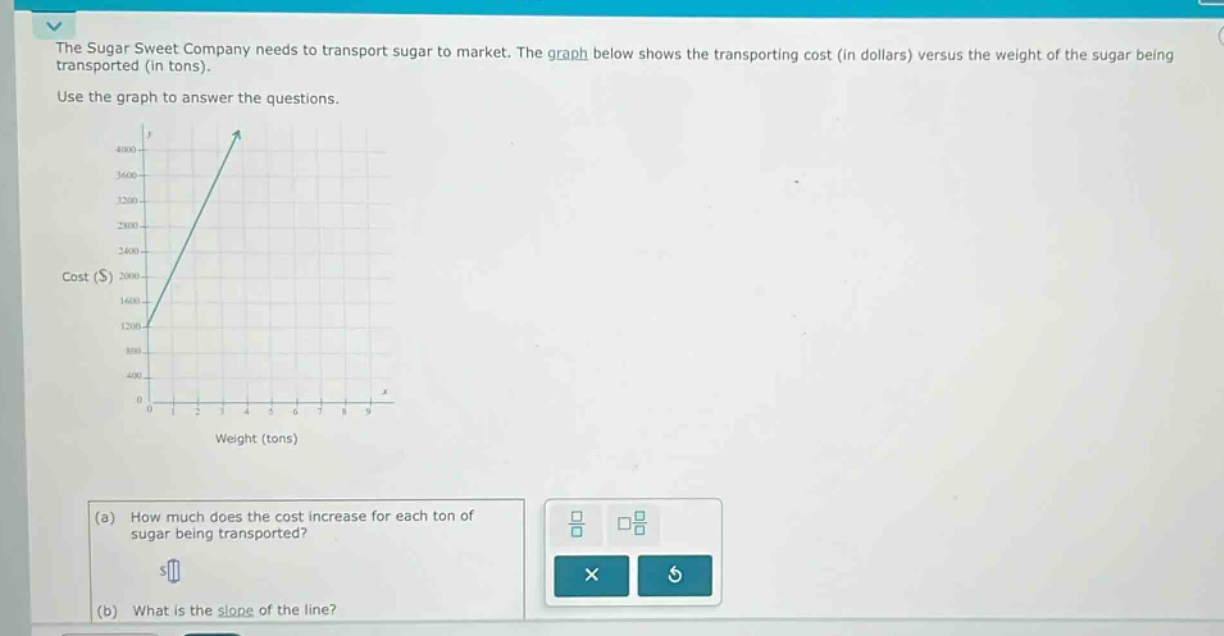
the sugar sweet company needs to transport sugar to market. the graph below shows the transporting cost (in dollars) versus the weight of the sugar being transported (in tons). use the graph to answer the questions. (a) how much does the cost increase for each ton of sugar being transported? (b) what is the slope of the line?
Answer
Explanation:
Step1: Select two points on the line
Let's take the points (0, 1200) and (1, 1600).
Step2: Use the slope - formula
The slope formula is $m=\frac{y_2 - y_1}{x_2 - x_1}$. Here, $x_1 = 0,y_1=1200,x_2 = 1,y_2 = 1600$. Then $m=\frac{1600 - 1200}{1-0}$.
Step3: Calculate the value
$\frac{1600 - 1200}{1-0}=\frac{400}{1}=400$.
Answer:
(a) $400 (b) 400