to support a shelf, the diameter of a bolt can measure anywhere from 0.2 cm less than 1.5 cm to 0.2 cm…
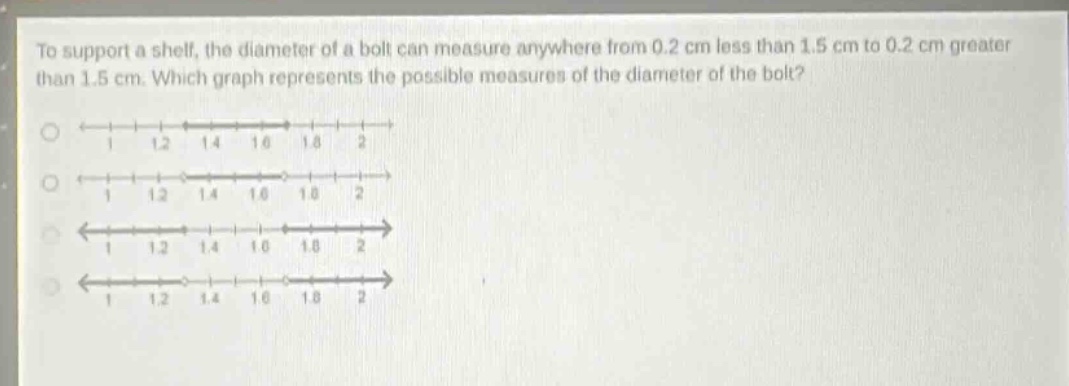
to support a shelf, the diameter of a bolt can measure anywhere from 0.2 cm less than 1.5 cm to 0.2 cm greater than 1.5 cm. which graph represents the possible measures of the diameter of the bolt?
Answer
Explanation:
Step1: Calculate the lower - bound
The lower - bound of the diameter of the bolt is $1.5−0.2 = 1.3$ cm.
Step2: Calculate the upper - bound
The upper - bound of the diameter of the bolt is $1.5 + 0.2=1.7$ cm.
Step3: Analyze the graph
The correct graph should have a closed - interval (since the values can be equal to the bounds) from $1.3$ to $1.7$. The first graph has endpoints at $1.2$ and $1.8$ which is incorrect. The second graph has open endpoints which is incorrect as the values $1.3$ and $1.7$ are included. The third graph has the correct closed - interval from $1.3$ (represented as $1.2$ to $1.4$ with the correct endpoint being included) to $1.7$ (represented as $1.6$ to $1.8$ with the correct endpoint being included). The fourth graph has open endpoints.
Answer:
The third graph.