which system of linear inequalities is represented by the graph?\no $y\\geq x - 2$ and $y\\leq x + 1$\no…
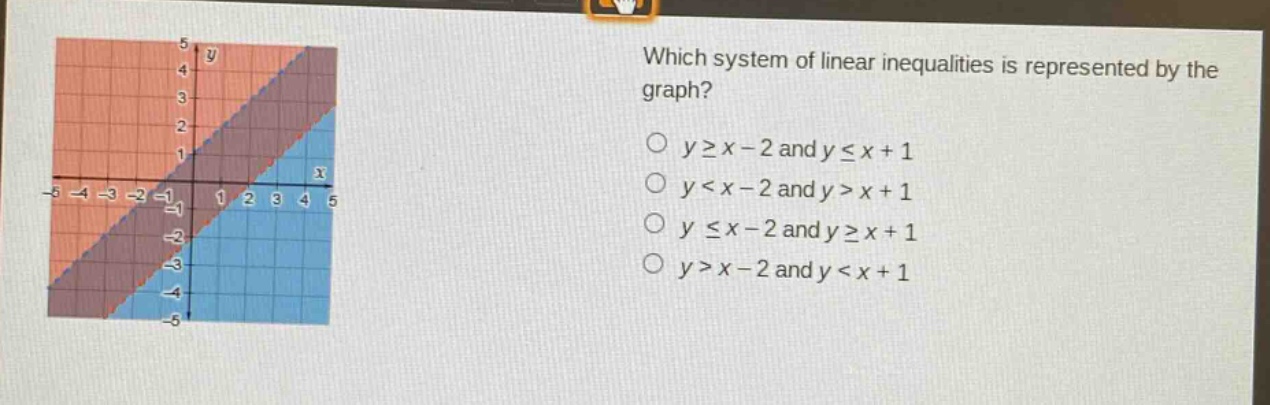
which system of linear inequalities is represented by the graph?\no $y\\geq x - 2$ and $y\\leq x + 1$\no $y<x - 2$ and $y>x + 1$\no $y\\leq x - 2$ and $y\\geq x + 1$\no $y>x - 2$ and $y<x + 1$
Answer
Explanation:
Step1: Identify the first line
The first line has a slope of 1 and y - intercept of - 2. The shaded region above this line (including the line itself) means the inequality is $y\geq x - 2$.
Step2: Identify the second line
The second line has a slope of 1 and y - intercept of 1. The shaded region below this line (including the line itself) means the inequality is $y\leq x + 1$.
Answer:
$y\geq x - 2$ and $y\leq x + 1$ (First option)