which system of linear inequalities is represented by the graph?\n\n$y \\geq x - 2$ and $y \\leq x + 1$\n$y…
which system of linear inequalities is represented by the graph?\n\n$y \\geq x - 2$ and $y \\leq x + 1$\n$y < x - 2$ and $y > x + 1$\n$y \\leq x - 2$ and $y \\geq x + 1$\n$y > x - 2$ and $y < x + 1$
Answer
Explanation:
Step1: Identify the first boundary line
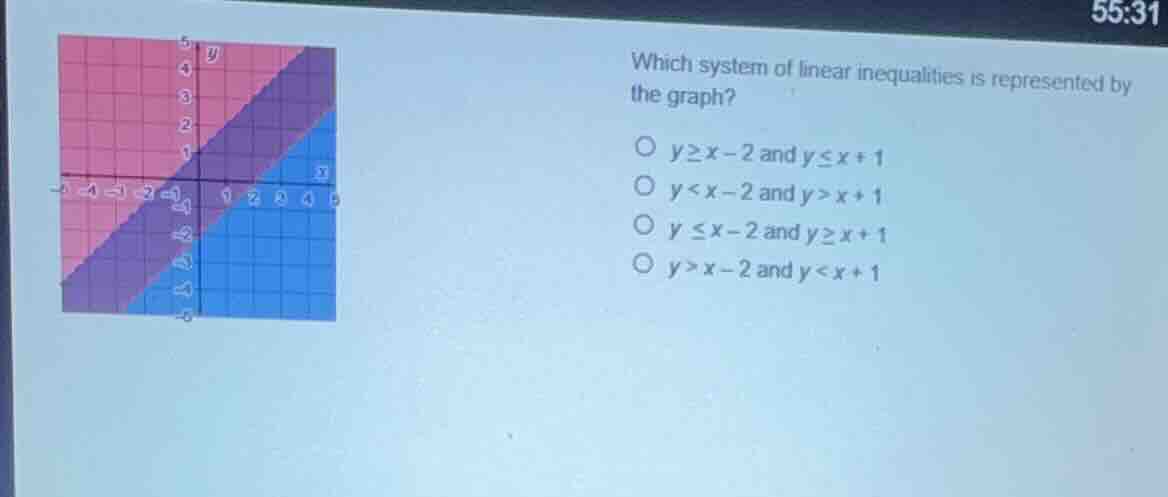
The upper boundary line passes through $(0, 1)$ and $(-1, 0)$, giving a slope $m = 1$ and $y$-intercept $b = 1$. $$y = x + 1$$
Step2: Determine the first inequality
The shaded region is below the solid line $y = x + 1$, indicating "less than or equal to". $$y \leq x + 1$$
Step3: Identify the second boundary line
The lower boundary line passes through $(2, 0)$ and $(0, -2)$, giving a slope $m = 1$ and $y$-intercept $b = -2$. $$y = x - 2$$
Step4: Determine the second inequality
The shaded region is above the solid line $y = x - 2$, indicating "greater than or equal to". $$y \geq x - 2$$
Step5: Combine the inequalities
The overlapping region represents the system of linear inequalities. $$y \geq x - 2 \text{ and } y \leq x + 1$$
Answer:
$y \geq x - 2$ and $y \leq x + 1$