the table below represents a function.\n|x|1|2|3|4|5|\n|y|6|12|18|24|30|\nwhich statement would best…
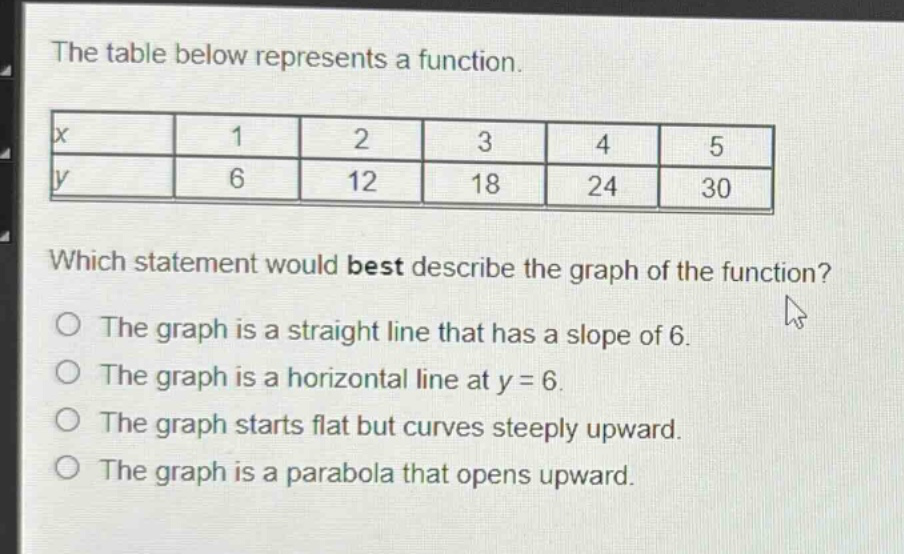
the table below represents a function.\n|x|1|2|3|4|5|\n|y|6|12|18|24|30|\nwhich statement would best describe the graph of the function?\no the graph is a straight line that has a slope of 6.\no the graph is a horizontal line at y = 6.\no the graph starts flat but curves steeply upward.\no the graph is a parabola that opens upward.
Answer
Explanation:
Step1: Recall slope - formula
The slope formula between two points $(x_1,y_1)$ and $(x_2,y_2)$ is $m=\frac{y_2 - y_1}{x_2 - x_1}$.
Step2: Select two points
Let's take $(x_1,y_1)=(1,6)$ and $(x_2,y_2)=(2,12)$.
Step3: Calculate the slope
$m=\frac{12 - 6}{2 - 1}=\frac{6}{1}=6$. We can check with other points, say $(x_1,y_1)=(3,18)$ and $(x_2,y_2)=(4,24)$. Then $m=\frac{24 - 18}{4 - 3}=\frac{6}{1}=6$. Since the ratio of the change in $y$ to the change in $x$ (slope) is constant for all pairs of points in the table, the function is linear with a slope of 6.
Answer:
The graph is a straight line that has a slope of 6.