the table below represents a function.\n|x|1|2|3|4|5|\n|y|1|16|64|256|1,024|\nwhich statement would best…
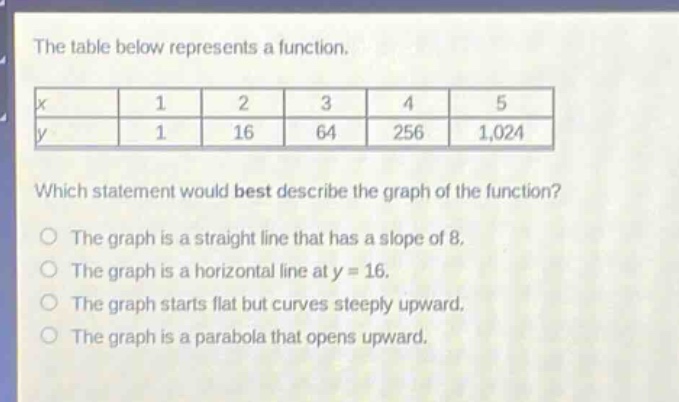
the table below represents a function.\n|x|1|2|3|4|5|\n|y|1|16|64|256|1,024|\nwhich statement would best describe the graph of the function?\nthe graph is a straight line that has a slope of 8.\nthe graph is a horizontal line at y = 16.\nthe graph starts flat but curves steeply upward.\nthe graph is a parabola that opens upward.
Answer
Explanation:
Step1: Analyze the y - values pattern
We have (y(1) = 1), (y(2)=16 = 2^4), (y(3)=64 = 4^3=2^6), (y(4)=256 = 4^4 = 2^8), (y(5)=1024=4^5 = 2^{10}). This is an exponential - type function of the form (y = a\cdot b^{x}) (where (a) and (b) are constants).
Step2: Recall the shape of different function graphs
A linear function (y=mx + c) has a straight - line graph. Here, the function is not linear as the differences between consecutive (y) - values are not constant. A horizontal line has the form (y = k) (constant), which is not the case here. A parabola has the form (y=ax^{2}+bx + c). This is not a quadratic function. An exponential function (y = a\cdot b^{x}) ((b>1)) starts relatively flat for small (x) - values and then curves steeply upward as (x) increases.
Answer:
The graph starts flat but curves steeply upward.