which table represents a nonlinear function?\n| x | y |\n|----|----|\n| 0 | -19 |\n| 1 | -11 |\n| 2 | -3…
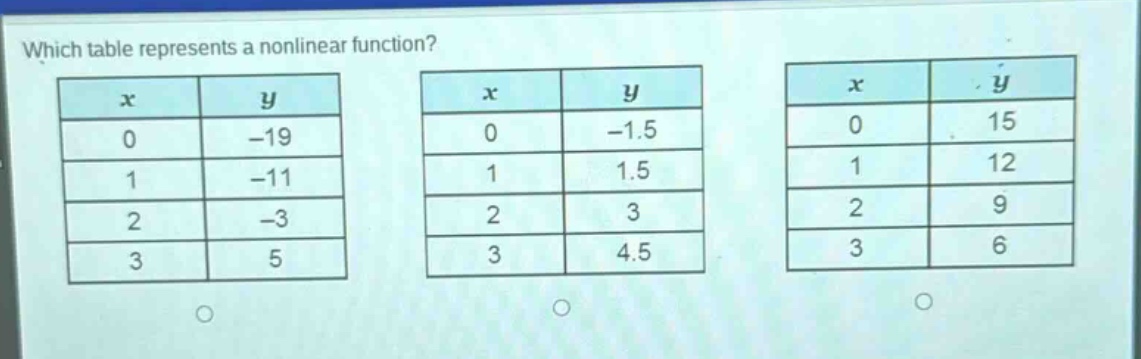
which table represents a nonlinear function?\n| x | y |\n|----|----|\n| 0 | -19 |\n| 1 | -11 |\n| 2 | -3 |\n| 3 | 5 |\n| x | y |\n|----|----|\n| 0 | -1.5 |\n| 1 | 1.5 |\n| 2 | 3 |\n| 3 | 4.5 |\n| x | y |\n|----|----|\n| 0 | 15 |\n| 1 | 12 |\n| 2 | 9 |\n| 3 | 6 |
Answer
Answer:
The second table (with (x = 0,y=-1.5;x = 1,y = 1.5;x=2,y = 3;x = 3,y=4.5)) represents a nonlinear function.
Explanation:
Step1: Recall linear - function property
For a linear function (y=mx + b), the rate of change (slope (m=\frac{\Delta y}{\Delta x})) is constant.
Step2: Calculate slopes for first table
For (x) from (0) to (1), (\frac{-11-(-19)}{1 - 0}=\frac{8}{1}=8). For (x) from (1) to (2), (\frac{-3-(-11)}{2 - 1}=\frac{8}{1}=8). For (x) from (2) to (3), (\frac{5-(-3)}{3 - 2}=\frac{8}{1}=8). Constant slope, so it's linear.
Step3: Calculate slopes for second table
For (x) from (0) to (1), (\frac{1.5-(-1.5)}{1 - 0}=\frac{3}{1}=3). For (x) from (1) to (2), (\frac{3 - 1.5}{2 - 1}=\frac{1.5}{1}=1.5). Slope is not constant, so it's nonlinear.
Step4: Calculate slopes for third table
For (x) from (0) to (1), (\frac{12-15}{1 - 0}=\frac{-3}{1}=-3). For (x) from (1) to (2), (\frac{9 - 12}{2 - 1}=\frac{-3}{1}=-3). For (x) from (2) to (3), (\frac{6 - 9}{3 - 2}=\frac{-3}{1}=-3). Constant slope, so it's linear.