the table shows the average height of a teenage girl at different ages.\n\n| age | 13 | 14 | 15 | 16 | 17 |…
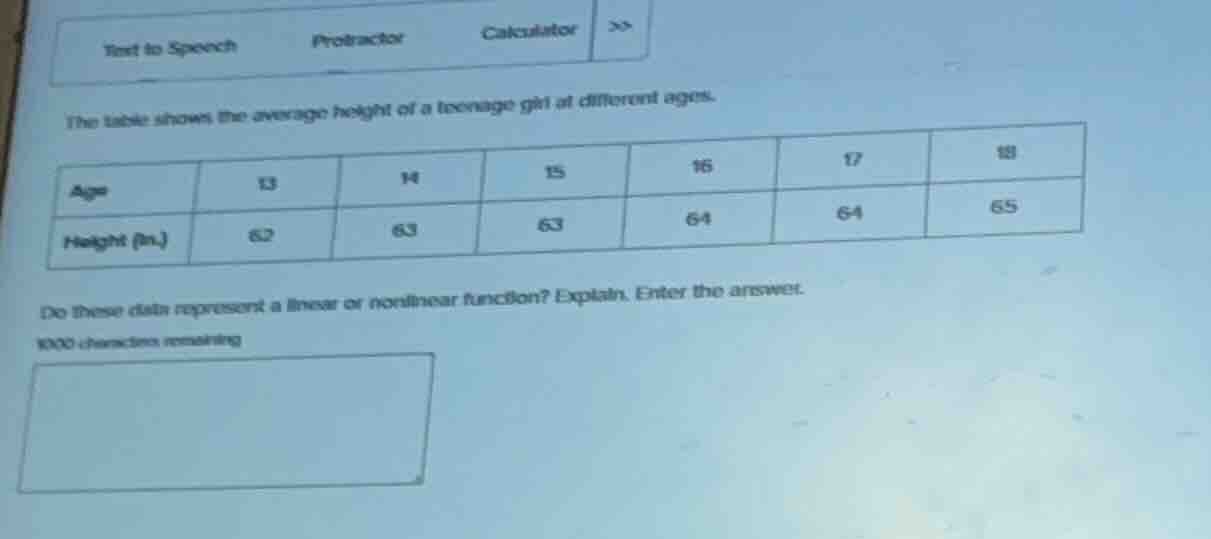
the table shows the average height of a teenage girl at different ages.\n\n| age | 13 | 14 | 15 | 16 | 17 | 18 |\n| :--- | :--- | :--- | :--- | :--- | :--- | :--- |\n| height (in.) | 62 | 63 | 63 | 64 | 64 | 65 |\n\ndo these data represent a linear or nonlinear function? explain. enter the answer.
Answer
Explanation:
Step1: Identify the change in age
The age increases by a constant value of 1 year for each interval. $$\Delta x = 14 - 13 = 1, \quad 15 - 14 = 1, \quad 16 - 15 = 1, \dots$$
Step2: Calculate the change in height
Find the difference in height for each consecutive age interval. $$\Delta y_1 = 63 - 62 = 1$$ $$\Delta y_2 = 63 - 63 = 0$$ $$\Delta y_3 = 64 - 63 = 1$$
Step3: Determine if the rate is constant
A linear function requires a constant rate of change ($\frac{\Delta y}{\Delta x}$). $$\text{Rates: } \frac{1}{1} = 1, \quad \frac{0}{1} = 0, \quad \frac{1}{1} = 1$$ Since the rate of change is not constant, the function is nonlinear.
Answer:
Nonlinear. The data represents a nonlinear function because the rate of change is not constant; the height increases by 1 inch between some years and remains the same (0 inch increase) between others.