the table shows the estimated number of bees, y, in a hive x days after a pesticide is released near the…
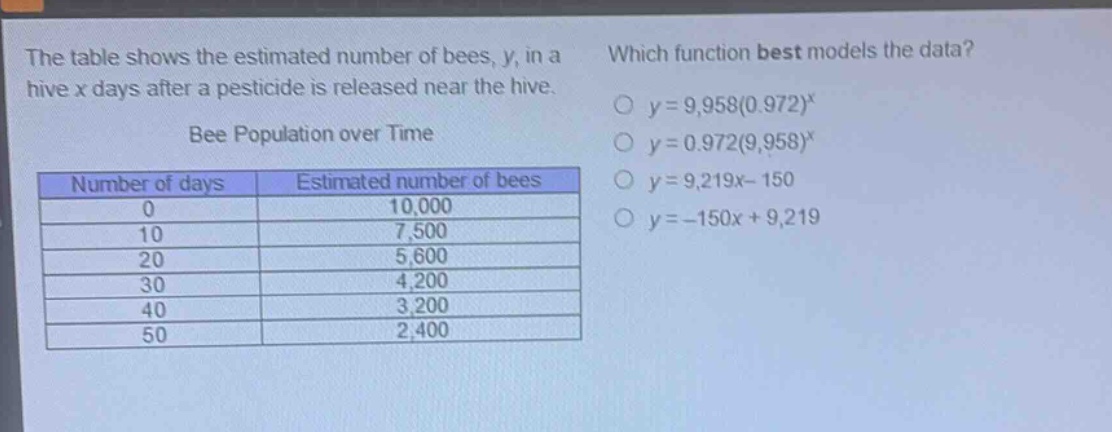
the table shows the estimated number of bees, y, in a hive x days after a pesticide is released near the hive. which function best models the data? bee population over time number of days estimated number of bees 0 10,000 10 7,500 20 5,600 30 4,200 40 3,200 50 2,400 y = 9,958(0.972)^x y = 0.972(9,958)^x y = 9,219x - 150 y = -150x + 9,219
Answer
Explanation:
Step1: Identify function types
The data shows a decreasing - trend over time. Linear functions (y = mx + b) (last two options) are either increasing ((m>0)) or decreasing ((m < 0)) at a constant rate. Exponential functions (y=a\cdot b^{x}) ((a\neq0), (b>0,b\neq1)) can show exponential growth ((b > 1)) or decay ((0 < b<1)). Since the number of bees is decreasing over time, we consider exponential decay ((0 < b<1)) and decreasing - linear functions.
Step2: Check the initial condition
When (x = 0), for an exponential function (y=a\cdot b^{x}), (y=a\cdot b^{0}=a). From the table, when (x = 0), (y = 10000). For (y = 9958(0.972)^{x}), when (x = 0), (y=9958(0.972)^{0}=9958\approx10000). For (y = 0.972(9958)^{x}), when (x = 0), (y=0.972(9958)^{0}=0.972\neq10000). For (y = 9219x-150), when (x = 0), (y=- 150\neq10000). For (y=-150x + 9219), when (x = 0), (y = 9219\neq10000).
Step3: Analyze the rate of change
The number of bees is decreasing in a non - linear way (the difference in the number of bees between consecutive time intervals is not constant), so a linear function is not appropriate. The exponential function (y = 9958(0.972)^{x}) with (0<0.972 < 1) represents exponential decay and is consistent with the data trend.
Answer:
(y = 9958(0.972)^{x})