which table shows exponential decay?\n| x | y |\n|----|----|\n| 1 | 16 |\n| 2 | 8 |\n| 3 | 4 |\n| 4 | 2 |\n|…
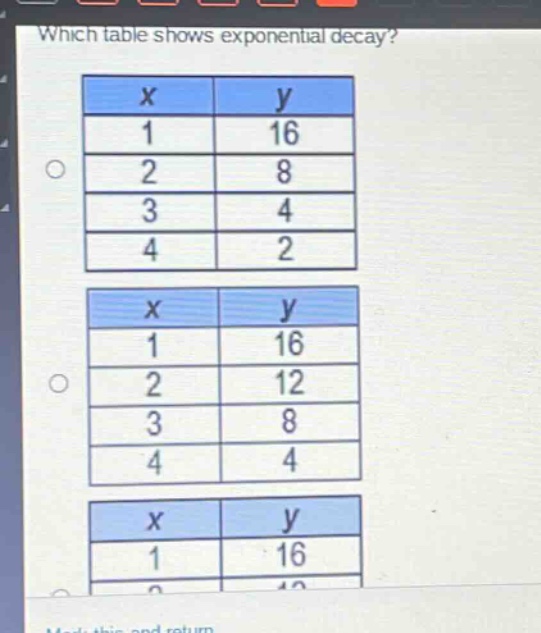
which table shows exponential decay?\n| x | y |\n|----|----|\n| 1 | 16 |\n| 2 | 8 |\n| 3 | 4 |\n| 4 | 2 |\n| x | y |\n|----|----|\n| 1 | 16 |\n| 2 | 12 |\n| 3 | 8 |\n| 4 | 4 |\n| x | y |\n|----|----|\n| 1 | 16 |
Answer
Answer:
The first table shows exponential decay.
Explanation:
Step1: Recall exponential - decay formula
The general form of an exponential - decay function is $y = a\cdot b^{x}$, where $a>0$ and $0 < b<1$. In a table representing exponential decay, the ratio of consecutive $y$ - values for a constant increase in $x$ is a constant less than 1.
Step2: Check the first table
For the first table: When $x = 1,y = 16$; when $x = 2,y = 8$. The ratio of $y$ - values is $\frac{y_2}{y_1}=\frac{8}{16}=\frac{1}{2}$. When $x = 3,y = 4$. The ratio of $y$ - values is $\frac{y_3}{y_2}=\frac{4}{8}=\frac{1}{2}$. When $x = 4,y = 2$. The ratio of $y$ - values is $\frac{y_4}{y_3}=\frac{2}{4}=\frac{1}{2}$. Since the ratio of consecutive $y$ - values is a constant $\frac{1}{2}<1$, it shows exponential decay.
Step3: Check the second table
For the second table: When $x = 1,y = 16$; when $x = 2,y = 12$. The ratio of $y$ - values is $\frac{y_2}{y_1}=\frac{12}{16}=\frac{3}{4}$. When $x = 3,y = 8$. The ratio of $y$ - values is $\frac{y_3}{y_2}=\frac{8}{12}=\frac{2}{3}$. Since the ratio of consecutive $y$ - values is not constant, it does not show exponential decay.
Step4: (Incomplete third table)
Since the third table is incomplete, we cannot fully analyze it. But from the first two tables, the first one already meets the criteria for exponential decay.