the table shows the total distance that myra runs over different time periods. time and distance ran by…
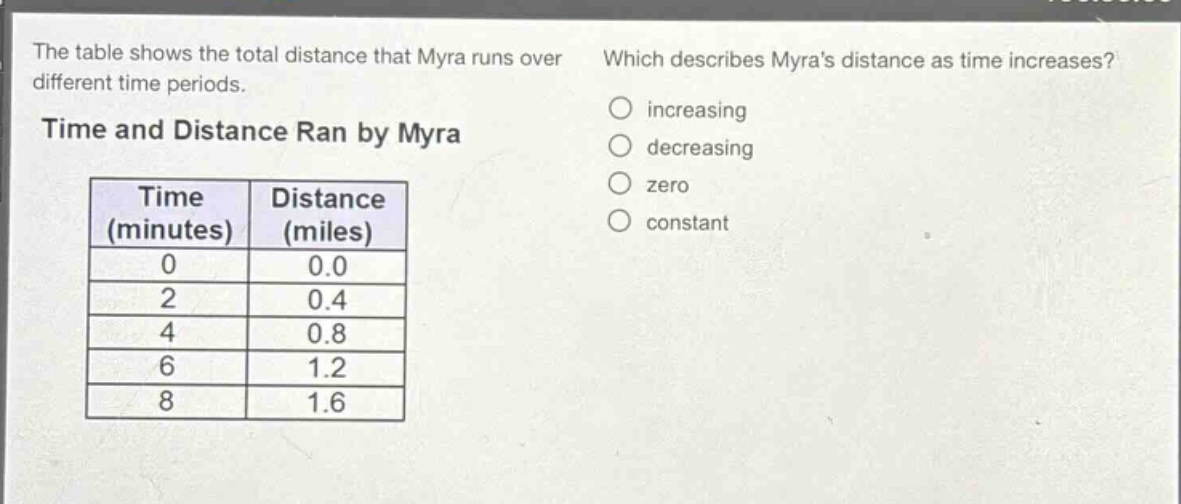
the table shows the total distance that myra runs over different time periods. time and distance ran by myra\n| time (minutes) | distance (miles) |\n| ---- | ---- |\n| 0 | 0.0 |\n| 2 | 0.4 |\n| 4 | 0.8 |\n| 6 | 1.2 |\n| 8 | 1.6 |\nwhich describes myras distance as time increases?\n○ increasing\n○ decreasing\n○ zero\n○ constant
Answer
Answer:
increasing
Explanation:
Step1: Observe time - distance pairs
When time is 0 minutes, distance is 0.0 miles. When time is 2 minutes, distance is 0.4 miles. When time is 4 minutes, distance is 0.8 miles. When time is 6 minutes, distance is 1.2 miles. When time is 8 minutes, distance is 1.6 miles.
Step2: Analyze the trend
As the value of time (0, 2, 4, 6, 8) increases, the value of distance (0.0, 0.4, 0.8, 1.2, 1.6) also increases.