this table shows values that represent a quadratic function.\nwhat is the average rate of change for this…
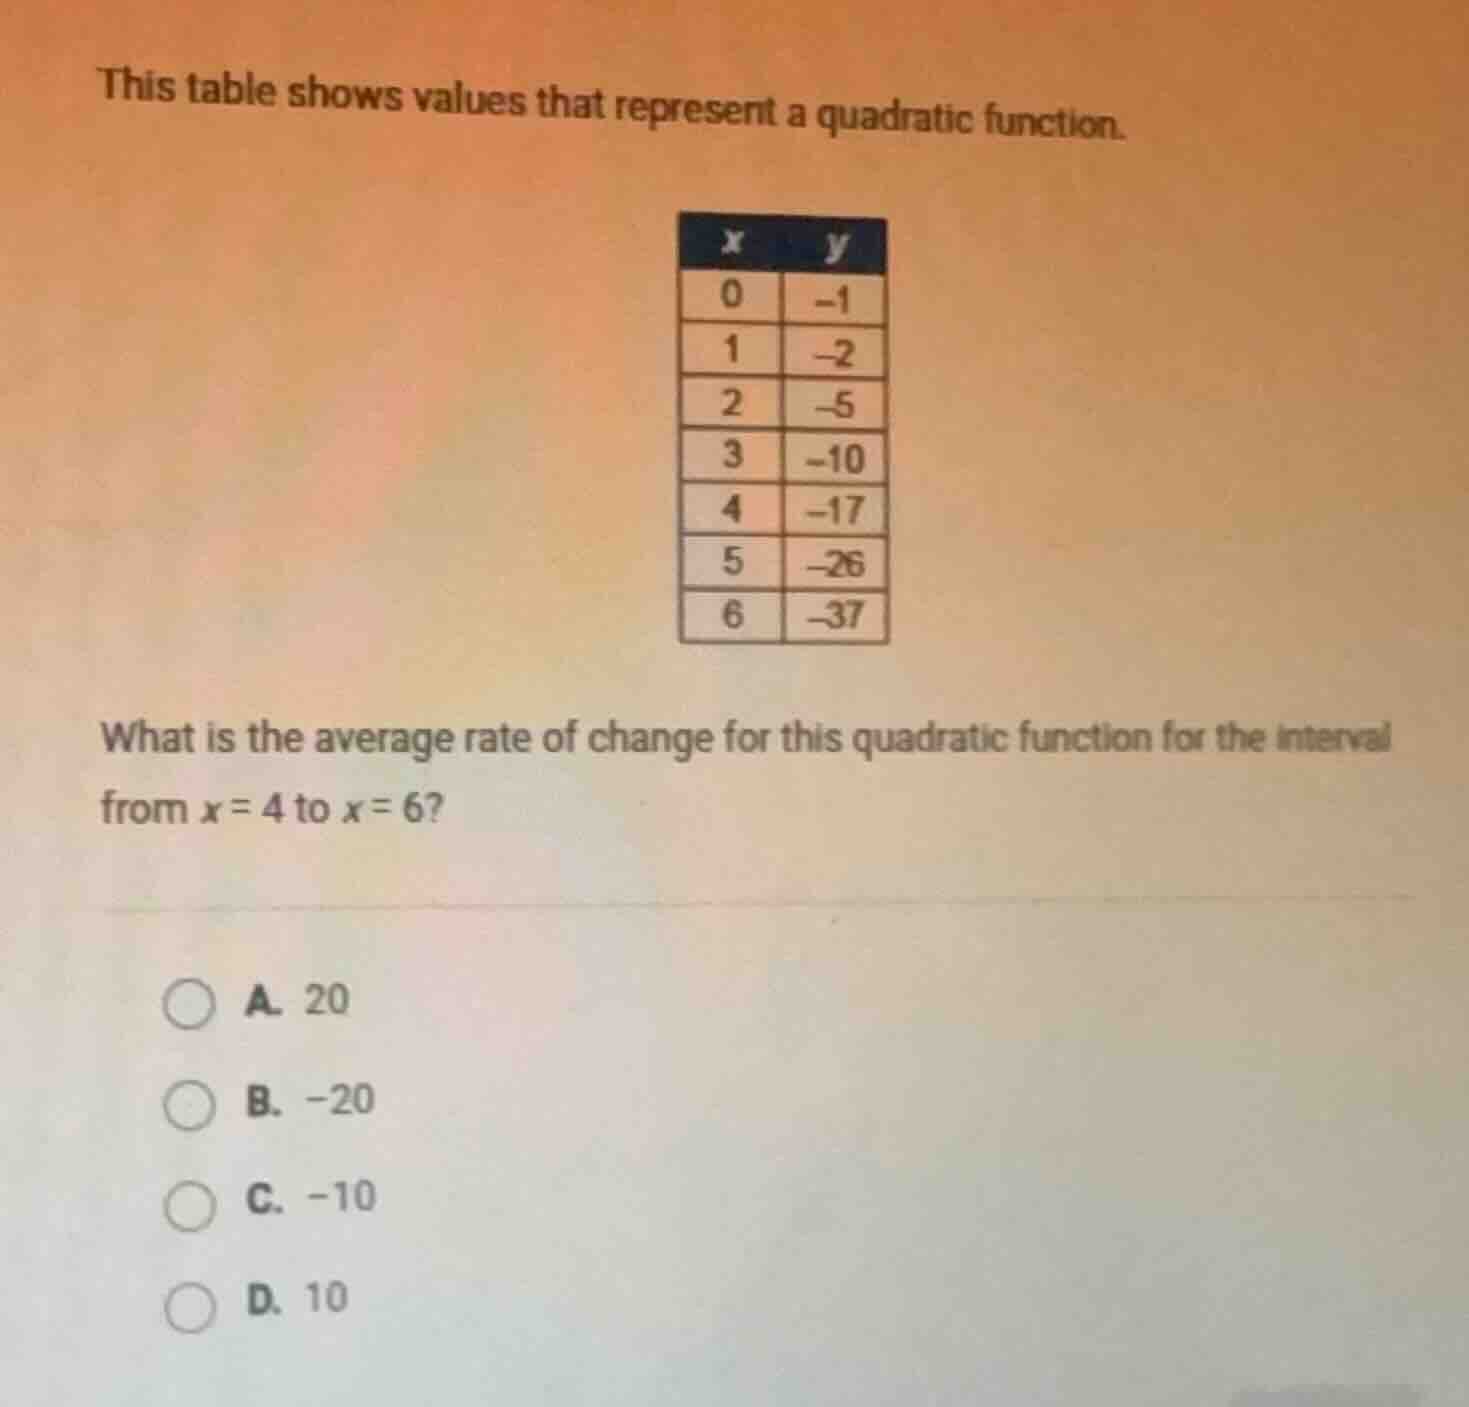
this table shows values that represent a quadratic function.\nwhat is the average rate of change for this quadratic function for the interval from $x=4$ to $x=6$\na. 20\nb. $-20$\nc. $-10$\nd. 10
Answer
Explanation:
Step1: Identify required function values
From the table: when $x=4$, $y=-17$; when $x=6$, $y=-37$.
Step2: Apply average rate formula
The average rate of change is $\frac{f(x_2)-f(x_1)}{x_2-x_1}$. Substitute values: $\frac{-37 - (-17)}{6 - 4}$
Step3: Simplify the expression
First calculate numerator: $-37 + 17 = -20$. Then calculate denominator: $6 - 4 = 2$. Finally: $\frac{-20}{2} = -10$
Answer:
C. -10