tickets for the school play sell for $4 each. which graph shows the relationship between the number of…
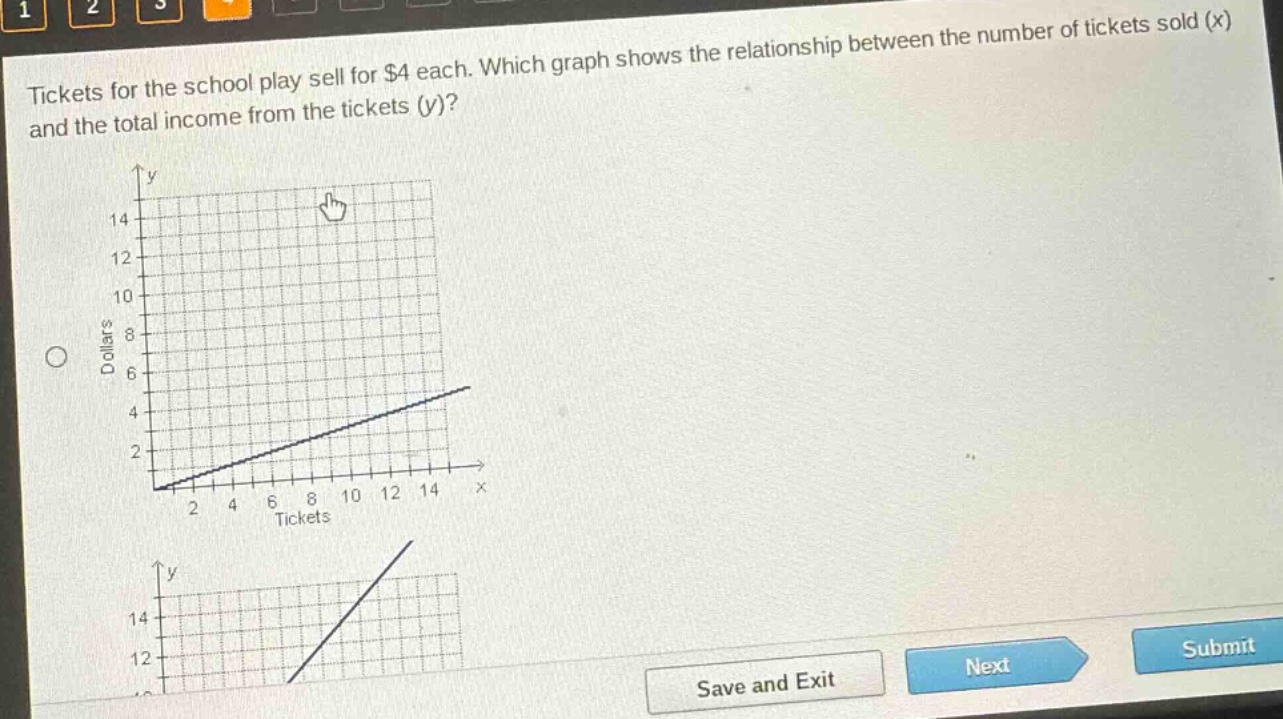
tickets for the school play sell for $4 each. which graph shows the relationship between the number of tickets sold (x) and the total income from the tickets (y)?
Answer
Explanation:
Step1: Establish the equation
The total income $y$ is the price per - ticket times the number of tickets sold. Since each ticket sells for $4$, the equation is $y = 4x$.
Step2: Analyze the slope and y - intercept
The equation $y = 4x$ is in the form $y=mx + b$, where $m = 4$ (the slope) and $b = 0$ (the y - intercept). This means the line passes through the origin $(0,0)$ and for every increase of 1 in $x$, $y$ increases by 4.
Answer:
The graph that passes through the origin $(0,0)$ and has a slope of 4 (for example, when $x = 1,y = 4$; when $x = 2,y = 8$ etc.) is the correct one. Without seeing all the options completely, the line should start at the origin and have a relatively steep positive - slope compared to a line with a slope less than 4.