tracie rides the bus home from school each day. the graph represents her distance from home relative to the…
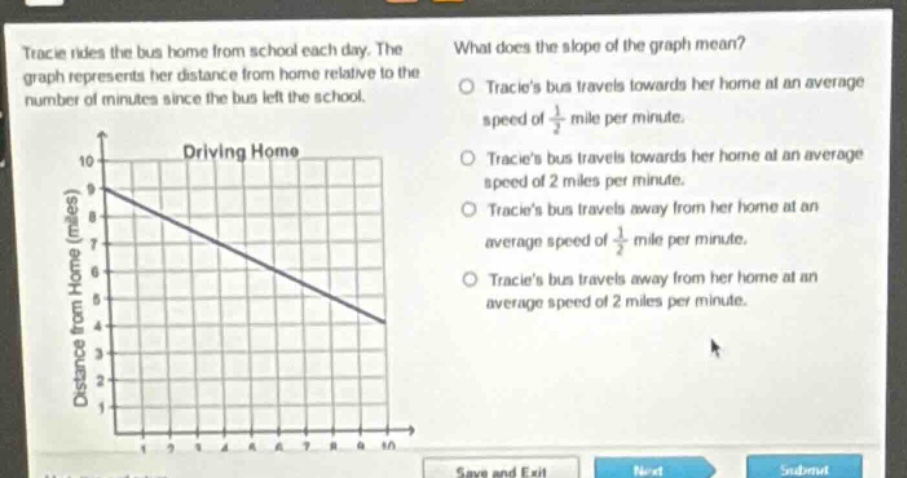
tracie rides the bus home from school each day. the graph represents her distance from home relative to the number of minutes since the bus left the school. what does the slope of the graph mean? tracies bus travels towards her home at an average speed of 1/2 mile per minute. tracies bus travels towards her home at an average speed of 2 miles per minute. tracies bus travels away from her home at an average speed of 1/2 mile per minute. tracies bus travels away from her home at an average speed of 2 miles per minute.
Answer
Explanation:
Step1: Identify slope - concept
Slope in a distance - time graph represents speed. If distance from home is decreasing, the bus is moving towards home.
Step2: Calculate slope
The line starts at (0, 9) and ends at (10, 4). Slope $m=\frac{y_2 - y_1}{x_2 - x_1}=\frac{4 - 9}{10-0}=\frac{- 5}{10}=-\frac{1}{2}$. The negative sign indicates the distance from home is decreasing (moving towards home) and the magnitude $\frac{1}{2}$ means the speed is $\frac{1}{2}$ mile per minute.
Answer:
Tracie's bus travels towards her home at an average speed of $\frac{1}{2}$ mile per minute.