two functions are defined as shown.\n$f(x)=-\frac{1}{2}x - 2$\n$g(x)=-1$\nwhich graph shows the input value…
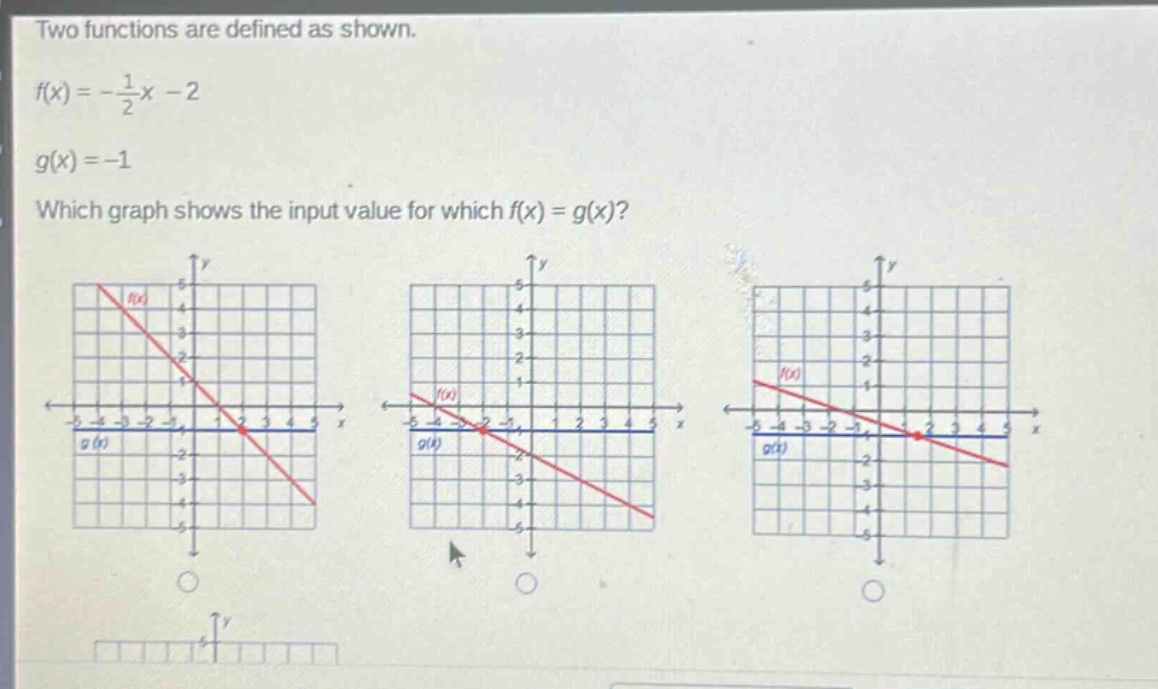
two functions are defined as shown.\n$f(x)=-\frac{1}{2}x - 2$\n$g(x)=-1$\nwhich graph shows the input value for which $f(x)=g(x)$?
Answer
Explanation:
Step1: Set f(x) equal to g(x)
[-\frac{1}{2}x - 2=-1]
Step2: Solve for x
Add 2 to both sides: [-\frac{1}{2}x=-1 + 2] [-\frac{1}{2}x=1] Multiply both sides by - 2: [x=-2] The graph where the line (y = f(x)=-\frac{1}{2}x - 2) intersects the horizontal line (y = g(x)=-1) at (x = - 2) is the correct one. In the graphs, we look for the intersection point of the line (y=-\frac{1}{2}x - 2) (a line with slope (-\frac{1}{2}) and y - intercept - 2) and the horizontal line (y = - 1) which occurs at (x=-2).
Answer:
The graph where the intersection of (y = f(x)) and (y = g(x)) is at (x=-2) (the second graph as the intersection point of the two lines has an x - coordinate of - 2).