use the equation to complete the table. y = x now, graph the equation.
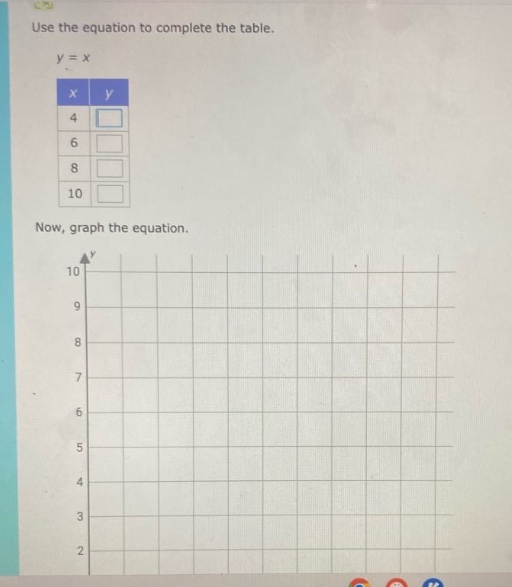
use the equation to complete the table. y = x now, graph the equation.
Answer
Explanation:
Step1: Sustituir valores de x en la ecuación
Dado que $y = x$, cuando $x = 4$, entonces $y=4$; cuando $x = 6$, entonces $y = 6$; cuando $x = 8$, entonces $y = 8$; cuando $x = 10$, entonces $y = 10$.
Answer:
| x | y |
|---|---|
| 4 | 4 |
| 6 | 6 |
| 8 | 8 |
| 10 | 10 |
Para graficar la ecuación $y = x$, se marcan los puntos $(4,4)$, $(6,6)$, $(8,8)$ y $(10,10)$ en la cuadrícula y se traza una línea recta que los una. Esta línea recta pasa por el origen $(0,0)$ y tiene una pendiente de 1.