the value of an antique plate after x years can be modeled by f(x)=18(1.05)^x. which graph can be used to…
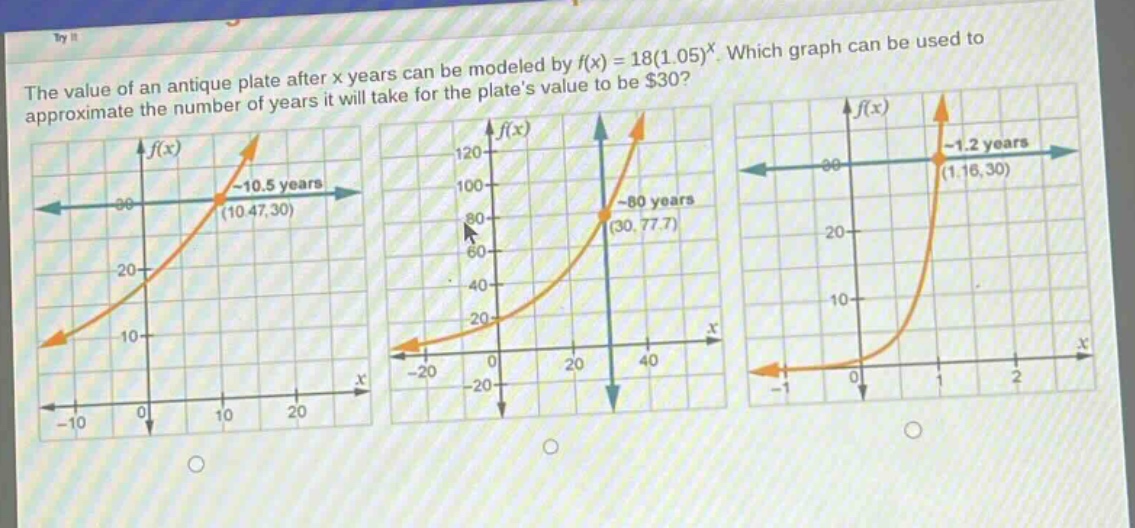
the value of an antique plate after x years can be modeled by f(x)=18(1.05)^x. which graph can be used to approximate the number of years it will take for the plates value to be $30?
Answer
Answer:
The first graph (with the point $(10.47,30)$)
Explanation:
Step1: Set up the equation
We want to find $x$ when $f(x)=30$. So, $30 = 18(1.05)^x$.
Step2: Solve for $x$
First, divide both sides by 18: $\frac{30}{18}=(1.05)^x$, or $\frac{5}{3}=(1.05)^x$. Then, take the natural - logarithm of both sides: $\ln(\frac{5}{3})=x\ln(1.05)$. So, $x = \frac{\ln(\frac{5}{3})}{\ln(1.05)}\approx\frac{0.5108}{0.0488}\approx10.47$. The graph that has the $x$ - value approximately equal to 10.47 when $y = 30$ is the first graph.