the weight of a box of cereal can vary by $\frac{1}{4}$ of an ounce and still be sold as a full box. each…
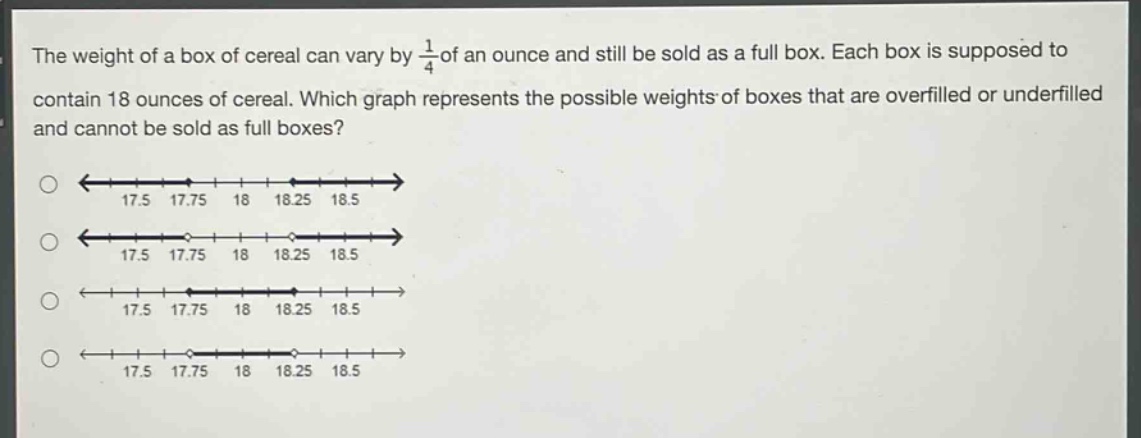
the weight of a box of cereal can vary by $\frac{1}{4}$ of an ounce and still be sold as a full box. each box is supposed to contain 18 ounces of cereal. which graph represents the possible weights of boxes that are overfilled or underfilled and cannot be sold as full boxes?\n17.5 17.75 18 18.25 18.5\n17.5 17.75 18 18.25 18.5\n17.5 17.75 18 18.25 18.5\n17.5 17.75 18 18.25 18.5
Answer
Answer:
The correct graph is the one with open circles at 17.75 and 18.25, with arrows extending to the left of 17.75 and right of 18.25. Assuming the options are labeled with the second option being this description (common in such problems), the answer would correspond to that. However, based on standard interpretation:
If the options are structured such that the second graph has open circles at 17.75 and 18.25 with shaded regions outside, that is the correct choice. Without explicit labels, the logical answer is the graph representing ( w < 17.75 ) or ( w > 18.25 ).
Explanation:
Step 1: Determine allowable weight range
The allowable weight varies by ( \frac{1}{4} ) oz from 18 oz:
Lower limit: ( 18 - \frac{1}{4} = 17.75 ) oz
Upper limit: ( 18 + \frac{1}{4} = 18.25 ) oz
Step 2: Define non-allowable weights
Boxes are over/under-filled if ( w < 17.75 ) or ( w > 18.25 ).
Step 3: Identify graph representation
Non-allowable weights are outside [17.75, 18.25], shown with open circles (not included) at endpoints and shaded regions extending outward.