while on vacation, aubrey took a helicopter ride to an island. the helicopter lifted off, cruised at the…
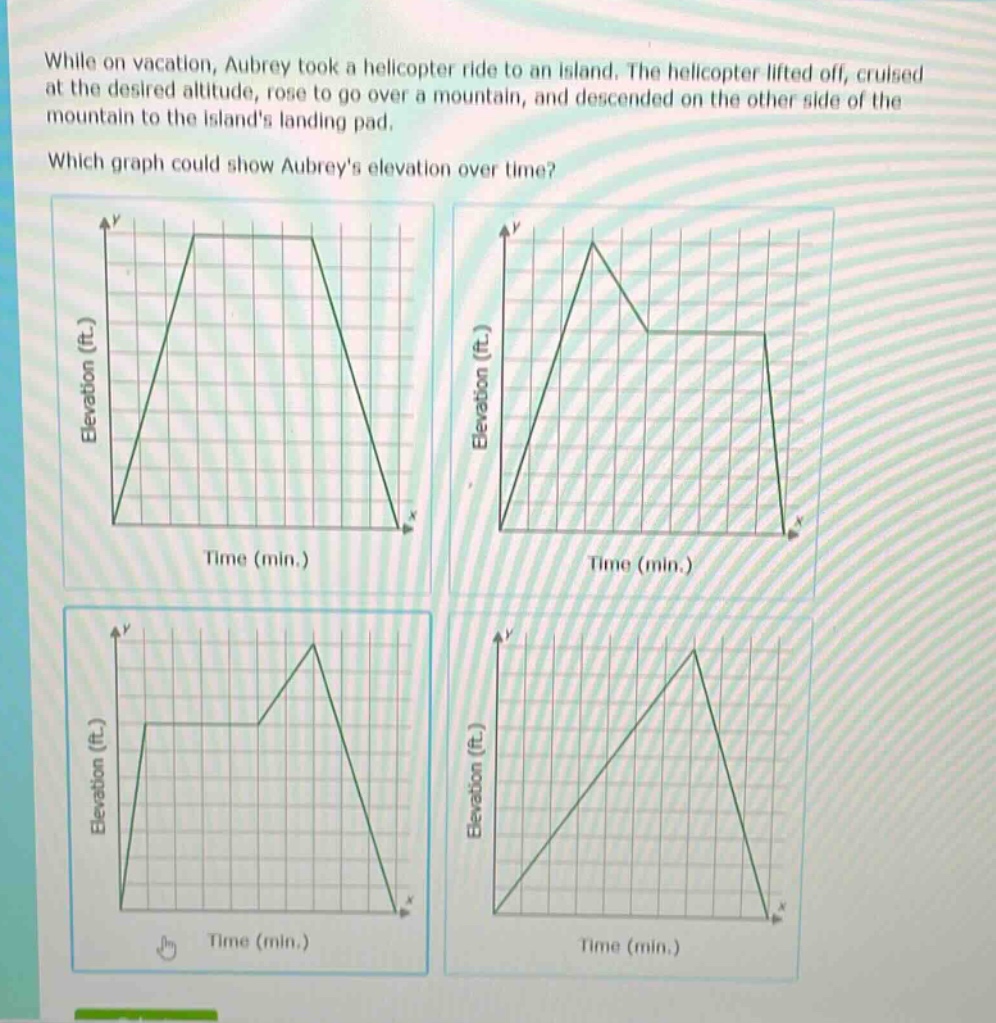
while on vacation, aubrey took a helicopter ride to an island. the helicopter lifted off, cruised at the desired altitude, rose to go over a mountain, and descended on the other side of the mountain to the islands landing pad. which graph could show aubreys elevation over time?
Answer
Explanation:
Step1: Analyze lift - off phase
The helicopter starts on the ground, so elevation is 0 at the start. As it lifts off, the elevation increases with time, giving a rising line on the graph.
Step2: Analyze cruising phase
After lifting off, it cruises at a desired altitude. During this time, the elevation remains constant, so the graph has a horizontal line.
Step3: Analyze rising - over - mountain phase
To go over the mountain, it rises again, so the graph has another rising line.
Step4: Analyze descending phase
After going over the mountain, it descends to the landing pad, so the graph has a falling line until it reaches an elevation of 0 again.
The second graph from the top left (in a 2 - by - 2 grid of graphs) shows these characteristics: it starts at 0, has an initial rise, then a horizontal section, then another rise, followed by a horizontal section and finally a fall back to 0.
Answer:
The second graph from the top left in the 2 - by - 2 grid of graphs.