a wholesaler requires a minimum of 4 items in each order from its retail customers. the manager of one…
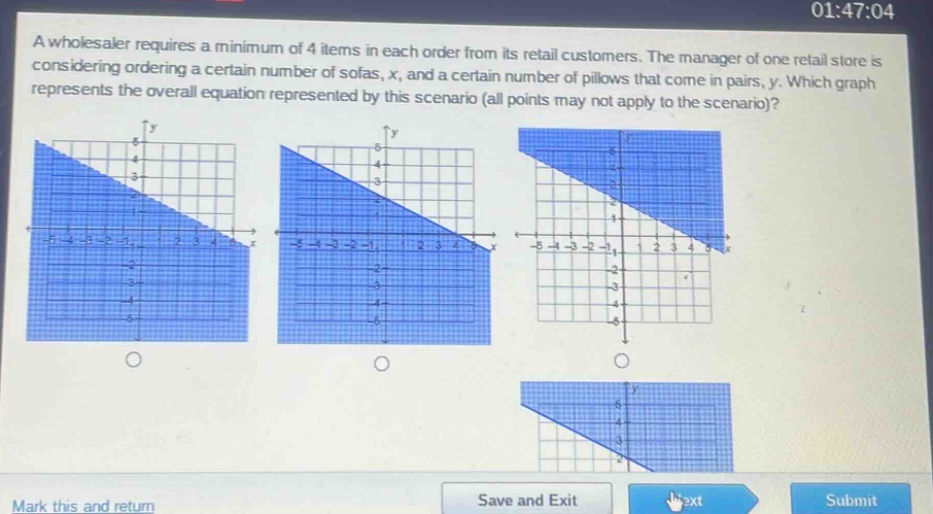
a wholesaler requires a minimum of 4 items in each order from its retail customers. the manager of one retail store is considering ordering a certain number of sofas, x, and a certain number of pillows that come in pairs, y. which graph represents the overall equation represented by this scenario (all points may not apply to the scenario)?
Answer
Explanation:
Step1: Form the inequality
The wholesaler requires a minimum of 4 items. Since the number of sofas is $x$ and the number of pillows (in pairs) is $y$ (so the number of individual - pillows is $2y$), the total number of items is $x + 2y$. The inequality representing the situation is $x+2y\geq4$.
Step2: Rewrite in slope - intercept form
Solve $x + 2y\geq4$ for $y$. First, subtract $x$ from both sides: $2y\geq - x + 4$. Then divide by 2: $y\geq-\frac{1}{2}x + 2$. The boundary line is $y=-\frac{1}{2}x + 2$, which has a $y$ - intercept of 2 and a slope of $-\frac{1}{2}$. Since the inequality is $y\geq-\frac{1}{2}x + 2$, the region above the line (including the line itself) is shaded. Also, since $x\geq0$ and $y\geq0$ (you can't order a negative number of sofas or pillows), the graph is in the first - quadrant.
Answer:
The graph with a solid line $y =-\frac{1}{2}x+2$ and the region above this line (including the line) in the first - quadrant is the correct graph. Without seeing the exact options clearly, the correct graph should have a line with a negative slope of $-\frac{1}{2}$, cross the $y$ - axis at 2, and have the area above the line shaded in the first - quadrant.