after working for a few years, the instructor has $3,500 saved for rent. he rents an apartment that costs…
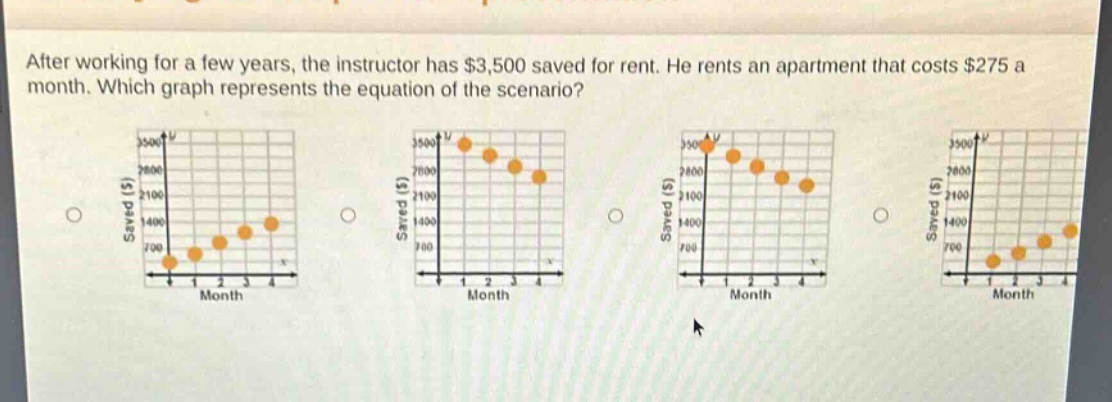
after working for a few years, the instructor has $3,500 saved for rent. he rents an apartment that costs $275 a month. which graph represents the equation of the scenario?
Answer
Explanation:
Step1: Determine the linear - equation
The instructor starts with $3500$ in savings and spends $275$ per month. Let $y$ be the amount of money saved and $x$ be the number of months. The equation is $y = 3500-275x$.
Step2: Find the $y$ - intercept
When $x = 0$ (at the start, before any months have passed), $y=3500$. So the line should cross the $y$ - axis at $3500$.
Step3: Find the slope
The slope of the line is $- 275$ since the amount of savings decreases by $275$ each month. As $x$ increases by $1$, $y$ decreases by $275$.
Step4: Analyze the graphs
We need to find a graph that starts at $(0,3500)$ and has a negative slope. The first graph starts too low on the $y$ - axis. The third and fourth graphs have positive slopes (the amount of savings would be increasing which is incorrect). The second graph starts at $(0,3500)$ and has a negative slope.