the yearbook club has 5 members returning from last year. they set up a booth in the cafeteria to recruit…
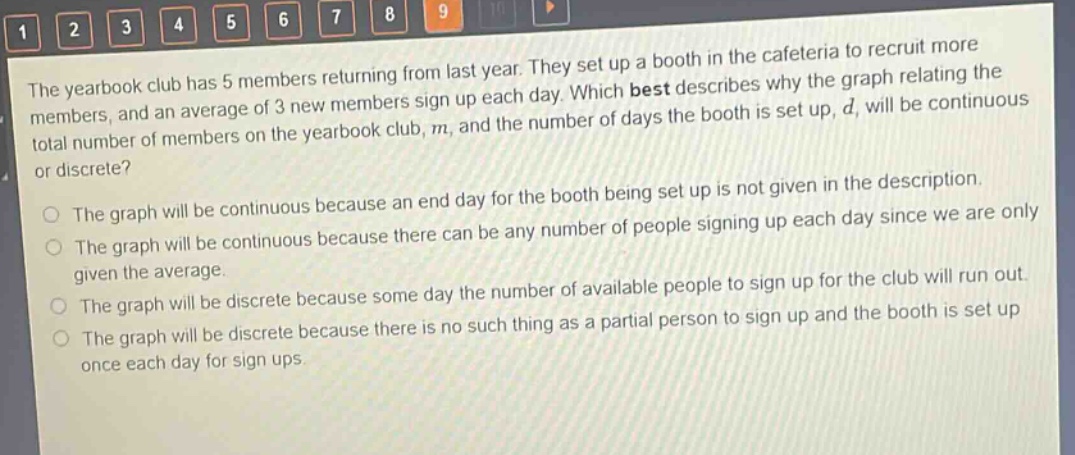
the yearbook club has 5 members returning from last year. they set up a booth in the cafeteria to recruit more members, and an average of 3 new members sign up each day. which best describes why the graph relating the total number of members on the yearbook club, m, and the number of days the booth is set up, d, will be continuous or discrete?\nthe graph will be continuous because an end - day for the booth being set up is not given in the description.\nthe graph will be continuous because there can be any number of people signing up each day since we are only given the average.\nthe graph will be discrete because some day the number of available people to sign up for the club will run out.\nthe graph will be discrete because there is no such thing as a partial person to sign up and the booth is set up once each day for sign - ups.
Answer
Brief Explanations:
In this context, the number of people signing up is a whole - number quantity as you can't have a fraction of a person. The booth is set up once a day for sign - ups. So, the data points representing the total number of members on different days will be distinct and separate, which is characteristic of a discrete graph.
Answer:
The graph will be discrete because there is no such thing as a partial person to sign up and the booth is set up once each day for sign ups.