age structure diagrams\nstructure diagram is a visual representation that shows how\nople are in different…
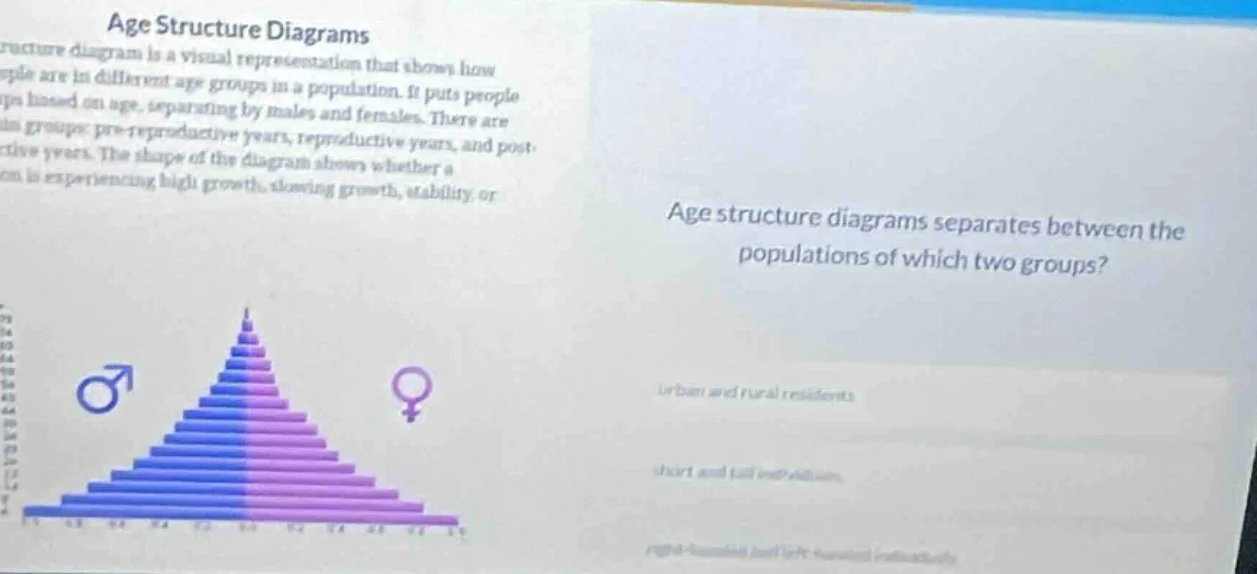
age structure diagrams\nstructure diagram is a visual representation that shows how\nople are in different age groups in a population. it puts people\nps based on age, separating by males and females. there are\nm groups: pre - reproductive years, reproductive years, and post-\nctive years. the shape of the diagram shows whether a\nom is experiencing high growth, slowing growth, stability or\n\nage structure diagrams separates between the\npopulations of which two groups?\n\nurban and rural residents\n\nshort and tall individuals\n\nright - handed and left - handed individuals
Answer
Brief Explanations:
The provided text about age structure diagrams explicitly states that these diagrams separate people by males and females, grouping them by age. The other options do not match the definition given.
Answer:
Males and Females (the option corresponding to this pair, as the visible options are partially obscured but the text confirms this is the correct grouping)