the bar graph shows sales of super - unleaded and supreme unleaded gasoline at a service station for the…
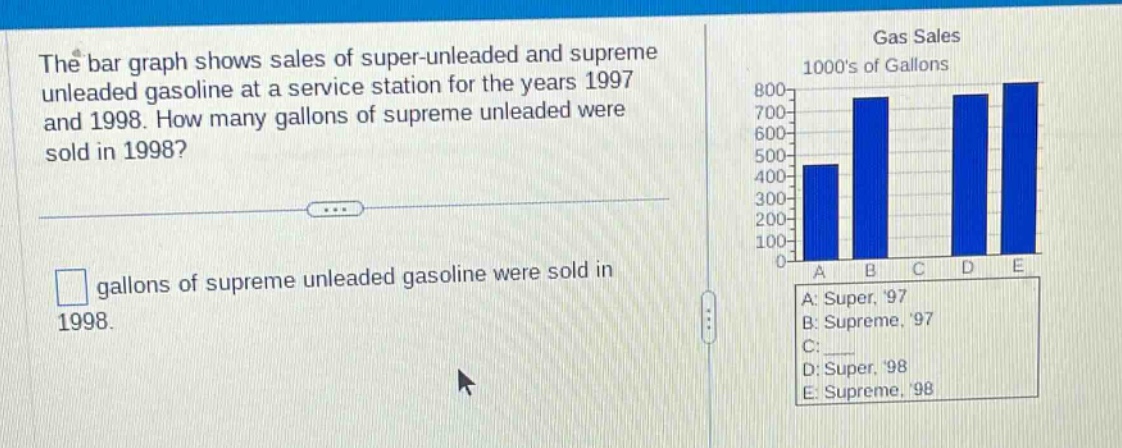
the bar graph shows sales of super - unleaded and supreme unleaded gasoline at a service station for the years 1997 and 1998. how many gallons of supreme unleaded were sold in 1998? gallons of supreme unleaded gasoline were sold in 1998. gas sales 1000s of gallons 800 700 600 500 400 300 200 100 0 a b c d e a: super, 97 b: supreme, 97 c: d: super, 98 e: supreme, 98
Answer
Explanation:
Step1: Identify the correct bar
The bar labeled 'E' represents supreme unleaded in 1998.
Step2: Read the value
The height of bar E reaches 800 on the y - axis which is in 1000s of gallons. So the number of gallons is (800\times1000 = 800000).
Answer:
800000