drag each tile to the correct box. jane is inserting a graph in her presentation. put the steps in the order…
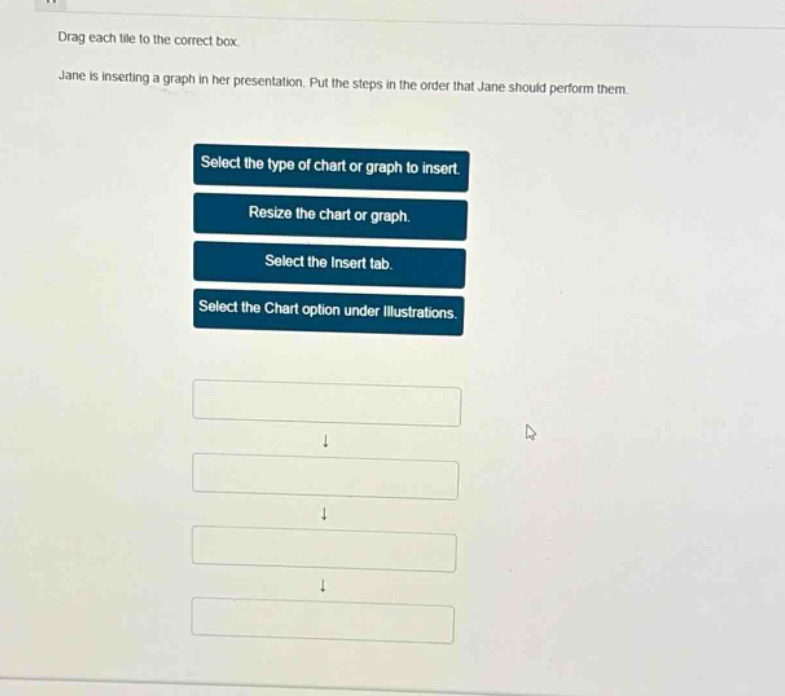
drag each tile to the correct box. jane is inserting a graph in her presentation. put the steps in the order that jane should perform them. select the type of chart or graph to insert. resize the chart or graph. select the insert tab. select the chart option under illustrations.
Answer
Brief Explanations:
First, access the Insert tab to start the insertion process. Then, within illustrations, choose the Chart option. After that, select the specific type of chart or graph. Finally, resize it as needed.
Answer:
- Select the Insert tab.
- Select the Chart option under illustrations.
- Select the type of chart or graph to insert.
- Resize the chart or graph.