grams of carbohydrates in 237 ml of fruit which reason provides the best explanation of why a bar graph was…
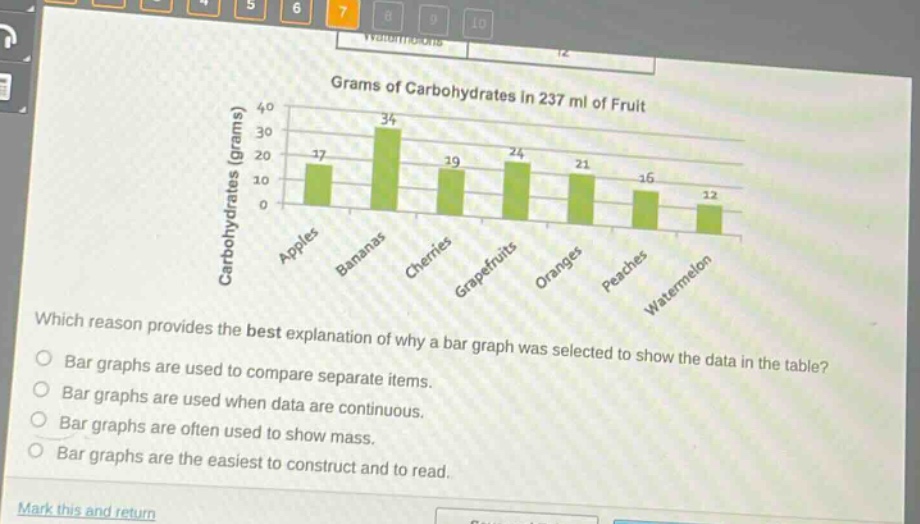
grams of carbohydrates in 237 ml of fruit which reason provides the best explanation of why a bar graph was selected to show the data in the table? bar graphs are used to compare separate items. bar graphs are used when data are continuous. bar graphs are often used to show mass. bar graphs are the easiest to construct and to read.
Answer
Answer:
A. Bar graphs are used to compare separate items.
Brief Explanations:
The data shows grams of carbohydrates in different fruits (separate items), and bar - graphs are ideal for comparing such distinct categories.