a group of 400 people were surveyed on their preferred t.v. programming.\npreferred t.v. programming\n| age…
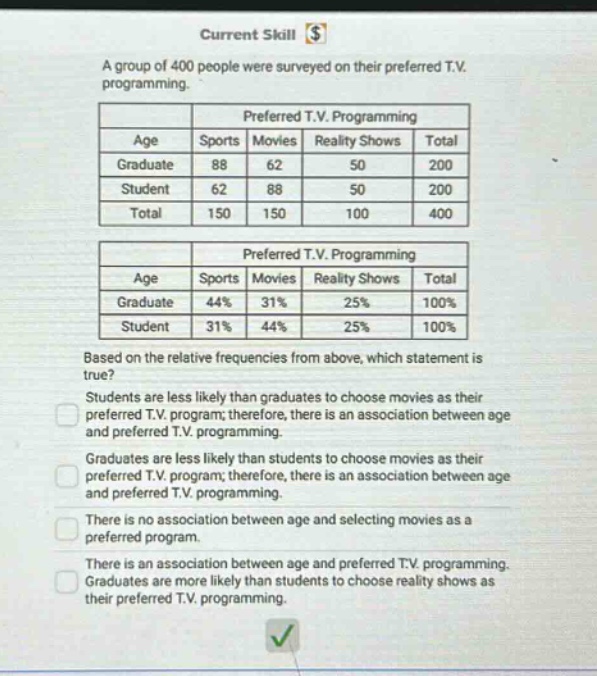
a group of 400 people were surveyed on their preferred t.v. programming.\npreferred t.v. programming\n| age | sports | movies | reality shows | total |\n| ---- | ---- | ---- | ---- | ---- |\n| graduate | 88 | 62 | 50 | 200 |\n| student | 62 | 88 | 50 | 200 |\n| total | 150 | 150 | 100 | 400 |\npreferred t.v. programming\n| age | sports | movies | reality shows | total |\n| ---- | ---- | ---- | ---- | ---- |\n| graduate | 44% | 31% | 25% | 100% |\n| student | 31% | 44% | 25% | 100% |\nbased on the relative frequencies from above, which statement is true?\nstudents are less likely than graduates to choose movies as their preferred t.v. program; therefore, there is an association between age and preferred t.v. programming.\ngraduates are less likely than students to choose movies as their preferred t.v. program; therefore, there is an association between age and preferred t.v. programming.\nthere is no association between age and selecting movies as a preferred program.\nthere is an association between age and preferred t.v. programming. graduates are more likely than students to choose reality shows as their preferred t.v. programming.
Answer
Explanation:
Step1: Analyze movie - preference percentages
Graduates have 31% preference for movies and students have 44% preference for movies. So, students are more likely than graduates to choose movies.
Step2: Analyze reality - show preference percentages
Graduates have 25% preference for reality shows and students have 25% preference for reality shows.
Step3: Determine association
Since students are more likely to choose movies and the percentages for reality - shows are the same, there is an association between age and preferred TV programming.