her teacher suggested that she redraw her graph as a line graph. why should she redraw the graph?\na line…
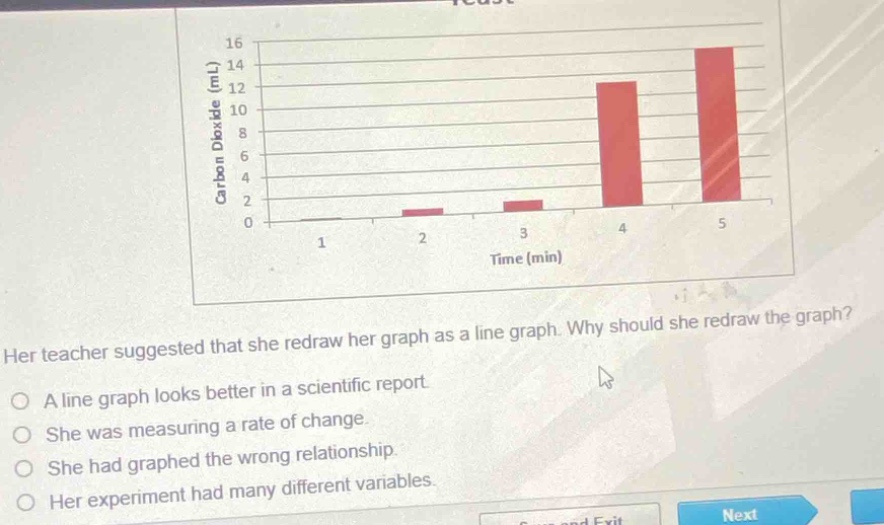
her teacher suggested that she redraw her graph as a line graph. why should she redraw the graph?\na line graph looks better in a scientific report.\nshe was measuring a rate of change.\nshe had graphed the wrong relationship.\nher experiment had many different variables.
Answer
Brief Explanations:
A line - graph is ideal for showing rates of change. Here, the amount of carbon dioxide is changing over time, so a line graph would better represent the rate of this change compared to a bar graph.
Answer:
She was measuring a rate of change.