the plot in the yp - plane shows the production of magnesium, p, in tons for the yth year after 1990 for a…
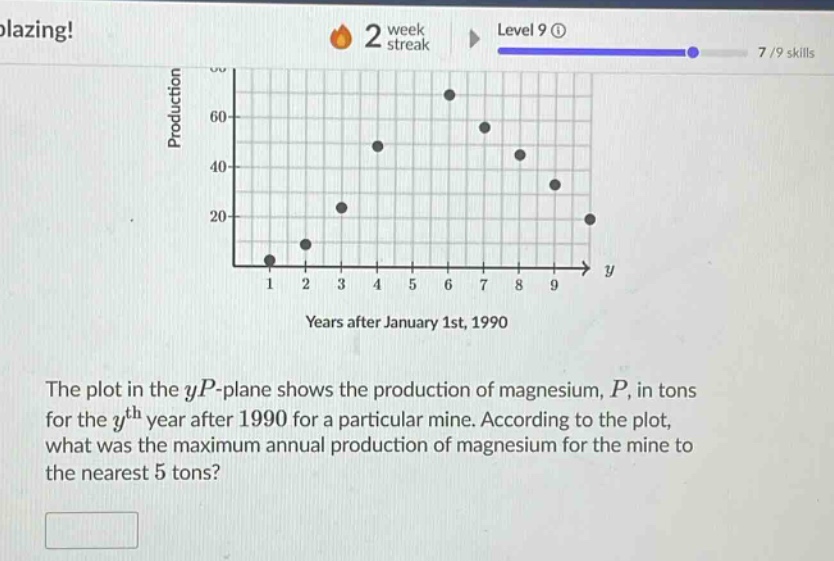
the plot in the yp - plane shows the production of magnesium, p, in tons for the yth year after 1990 for a particular mine. according to the plot, what was the maximum annual production of magnesium for the mine to the nearest 5 tons?
Answer
Explanation:
Step1: Identify the highest - point
Locate the highest data - point on the scatter - plot.
Step2: Read the production value
The highest point has a production value close to 70 tons. Since we need to round to the nearest 5 tons, and 70 is already a multiple of 5.
Answer:
70