the table and graph below record the data for the depth of the tide. use the information to identify the…
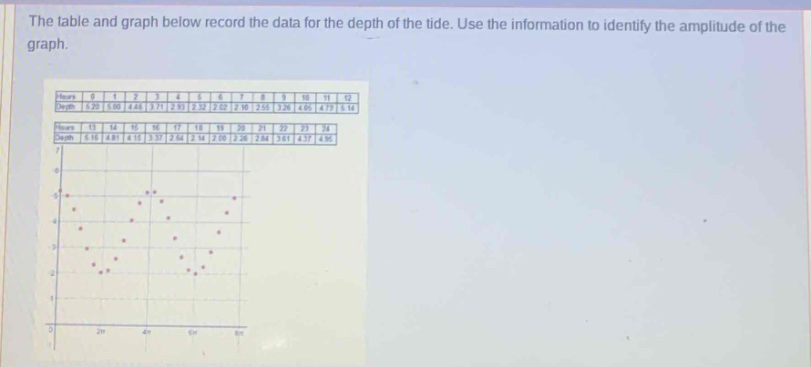
the table and graph below record the data for the depth of the tide. use the information to identify the amplitude of the graph.
Answer
Explanation:
Step1: Find maximum and minimum values
From the data, the maximum depth value is approximately $4.79$ and the minimum depth value is approximately $2.02$.
Step2: Calculate the amplitude
The formula for the amplitude of a periodic - like function (such as tide depth) is $A=\frac{\text{Max}-\text{Min}}{2}$. So, $A = \frac{4.79 - 2.02}{2}=\frac{2.77}{2}=1.385$.
Answer:
$1.385$