the accompanying figure shows the velocity v = \\(\\frac{ds}{dt}=f(t)\\) (m/sec) of a body moving along a…
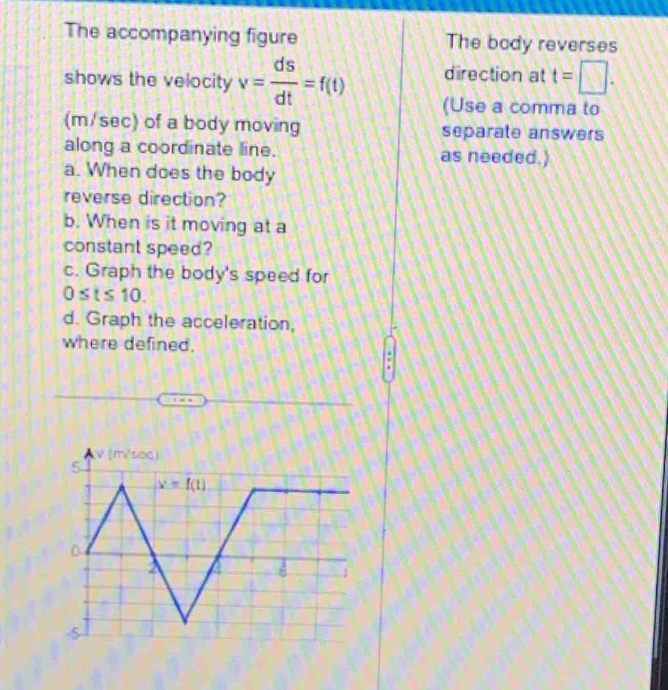
the accompanying figure shows the velocity v = \\(\\frac{ds}{dt}=f(t)\\) (m/sec) of a body moving along a coordinate line. a. when does the body reverse direction? b. when is it moving at a constant speed? c. graph the bodys speed for 0 ≤ t ≤ 10. d. graph the acceleration, where defined.
Answer
Explanation:
Step1: Recall velocity - direction relationship
The body reverses direction when velocity changes sign. We look for the values of (t) where (v = f(t)) crosses the (t) - axis. From the graph, (v=f(t)) crosses the (t) - axis at (t = 2) and (t=4).
Step2: Recall constant - speed condition
The body is moving at a constant speed when the magnitude of the velocity is constant. This occurs when the velocity function is a horizontal line. From the graph, (v) is constant (horizontal) on the intervals ([4,6]). The speed is (|v|), and since (v = 3) on ([4,6]), the body is moving at a constant speed on (4\leq t\leq6).
Step3: Graph the speed
Speed is the absolute - value of velocity, (s(t)=|v(t)|). For (0\leq t<2), (v(t)\geq0), so (s(t)=v(t)). For (2 < t<4), (v(t)<0), so (s(t)=-v(t)). For (4\leq t\leq6), (v(t)\geq0), so (s(t)=v(t)). We can plot the points based on the values of (v(t)) and take the absolute - value.
Step4: Recall acceleration formula
Acceleration (a(t)=\frac{dv}{dt}). The acceleration is the slope of the velocity - time graph. For (0 < t<2), the slope of (v(t)) is positive. For (2 < t<4), the slope of (v(t)) is negative. For (4 < t<6), the slope of (v(t)) is (0). We can calculate the slopes at different intervals to graph (a(t)).
Answer:
a. (t = 2,4) b. (4\leq t\leq6) c. To graph the speed:
- For (0\leq t<2), use the positive part of the (v(t)) graph.
- For (2 < t<4), reflect the negative part of the (v(t)) graph above the (t) - axis.
- For (4\leq t\leq6), use the positive part of the (v(t)) graph. d. To graph the acceleration:
- Calculate the slope of (v(t)) on different intervals. For (0 < t<2), the slope is positive. For (2 < t<4), the slope is negative. For (4 < t<6), the slope is (0). Plot these values of the slope as (a(t)) for the corresponding intervals of (t).