accumulation of stable atoms\nthe graph shows the accumulation of stable atoms during the decay of a…
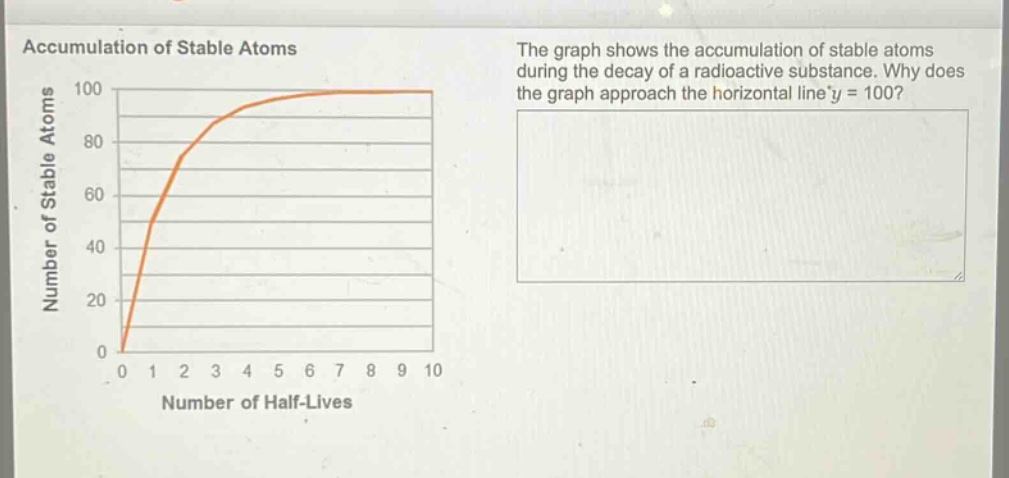
accumulation of stable atoms\nthe graph shows the accumulation of stable atoms during the decay of a radioactive substance. why does the graph approach the horizontal line y = 100?\nnumber of stable atoms\n0 1 2 3 4 5 6 7 8 9 10\nnumber of half - lives
Answer
Brief Explanations:
The initial amount of the radioactive substance is equivalent to 100 stable - atoms worth. As the radioactive substance decays over multiple half - lives, it eventually fully decays into stable atoms. So, the maximum number of stable atoms that can be accumulated is 100, which is why the graph approaches $y = 100$.
Answer:
The initial amount of the radioactive substance is equivalent to 100 stable - atoms worth and as it fully decays, the number of stable atoms approaches 100.