analyzing projectile motion represented by a table the table relates to a function h(t) that models the…
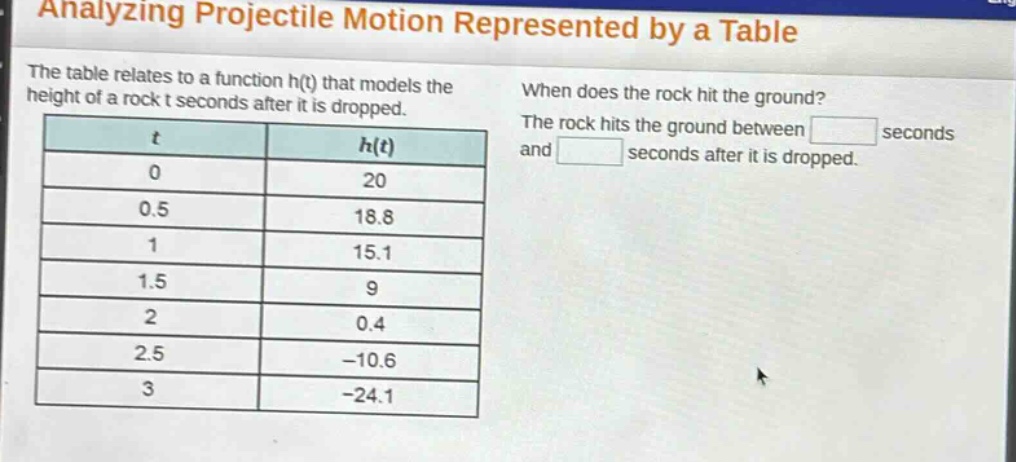
analyzing projectile motion represented by a table the table relates to a function h(t) that models the height of a rock t seconds after it is dropped. when does the rock hit the ground? the rock hits the ground between seconds and seconds after it is dropped. t h(t) 0 20 0.5 18.8 1 15.1 1.5 9 2 0.4 2.5 -10.6 3 -24.1
Answer
Explanation:
Step1: Identify ground - hitting condition
The rock hits the ground when (h(t)=0). We observe the values of (h(t)) in the table.
Step2: Analyze the sign - change
When (t = 2), (h(2)=0.4) (positive) and when (t = 2.5), (h(2.5)=- 10.6) (negative). Since the function (h(t)) is continuous (in the context of projectile motion), the zero of the function (where the rock hits the ground) must be between these two values of (t).
Answer:
2; 2.5