the atmospheric pressure at sea level is 14.7 lb/in². this pressure is reduced by half for each 3.6 miles…
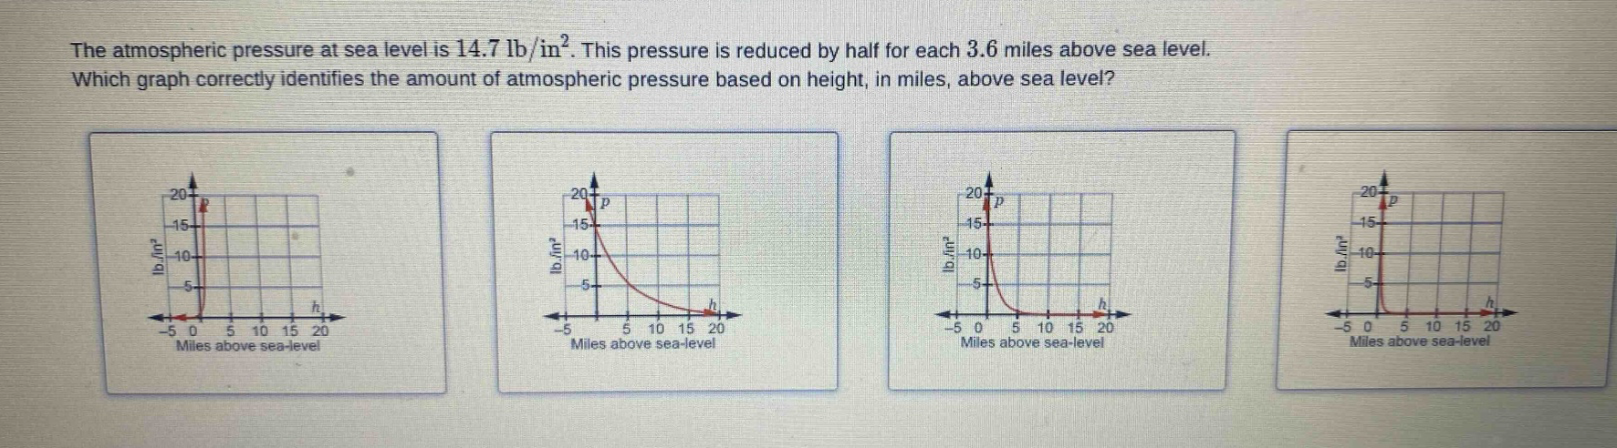
the atmospheric pressure at sea level is 14.7 lb/in². this pressure is reduced by half for each 3.6 miles above sea level. which graph correctly identifies the amount of atmospheric pressure based on height, in miles, above sea level?
Answer
Answer:
The graph that starts at the point $(0, 14.7)$ (since at sea - level $h = 0$ miles and pressure $p=14.7$ lb/in²) and is a decreasing exponential - like curve (because the pressure is reduced by half for each 3.6 miles increase in height). Among the given graphs, the one that has the $y$ - intercept at 14.7 and decreases as $x$ (miles above sea - level) increases is the correct one. Without seeing the full details of all the graphs, we can describe the characteristics of the correct graph. The correct graph should show a non - linear decrease in pressure as the height above sea - level increases.
Explanation:
Step1: Identify initial condition
At $h = 0$ (sea - level), $p = 14.7$ lb/in². So the graph must pass through the point $(0,14.7)$.
Step2: Analyze the rate of change
The pressure is reduced by half for each 3.6 miles increase in height. This is an exponential - decay relationship. As $h$ (height above sea - level) increases, $p$ (atmospheric pressure) decreases non - linearly.