based on this graph, which chart represents the energy for point a?
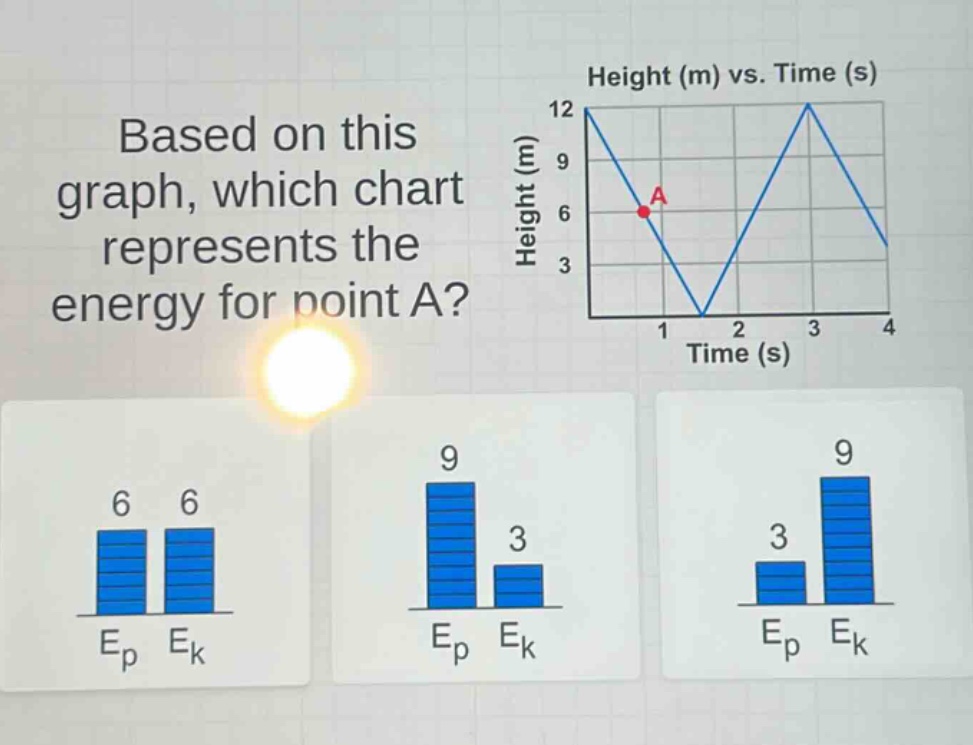
based on this graph, which chart represents the energy for point a?
Answer
Explanation:
Step1: Recall energy - height relationship
The potential energy $E_p = mgh$, where $h$ is the height. Kinetic energy $E_k$ is related to the motion. At a non - maximum height, both $E_p$ and $E_k$ are non - zero. The total mechanical energy $E = E_p+E_k$ is conserved (assuming no non - conservative forces). At the maximum height, $E_k = 0$ and $E = E_p$, at the minimum height, $E_p=0$ and $E = E_k$.
Step2: Analyze point A height
Point A is at a height of 6 m. The maximum height is 12 m. Since the total mechanical energy is conserved, and assuming the mass $m$ and gravitational acceleration $g$ are constant, the potential energy $E_p$ at point A is non - zero and less than the maximum potential energy (at 12 m), and the kinetic energy $E_k$ is non - zero. Since the total mechanical energy is conserved, if we assume the total energy $E$ is 12 (for simplicity, taking $mg = 1$), at a height of 6 m, $E_p=6$ and $E_k = 6$ (because $E=E_p + E_k$ and $E$ is constant).
Answer:
The first chart (with $E_p = 6$ and $E_k = 6$)