which best describes his run?\no from time 0 to 6, he went fast and then slowed down.\no from time 6 to 10…
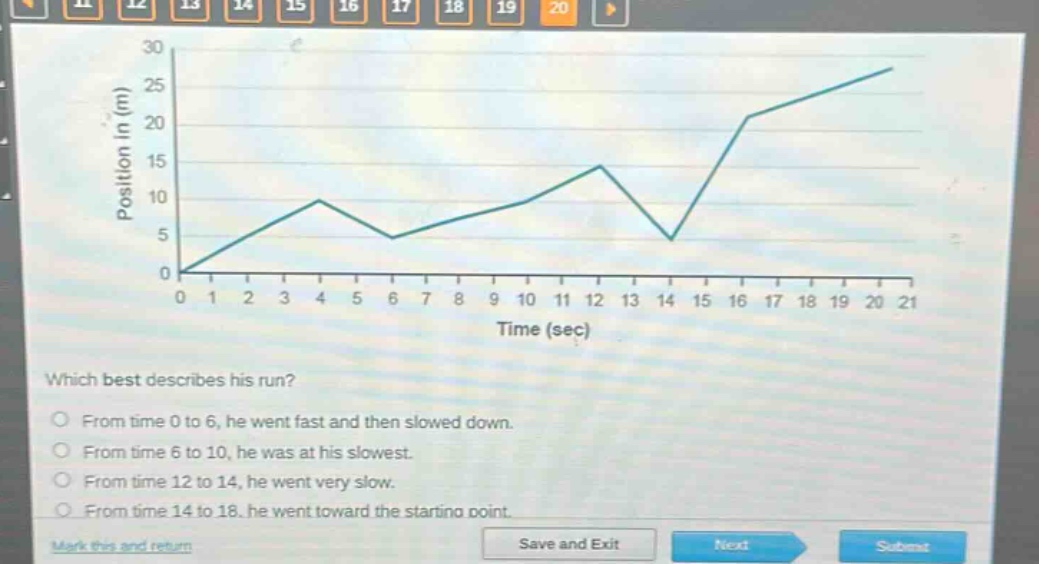
which best describes his run?\no from time 0 to 6, he went fast and then slowed down.\no from time 6 to 10, he was at his slowest.\no from time 12 to 14, he went very slow.\no from time 14 to 18, he went toward the starting point.
Answer
Brief Explanations:
- Analyze the slope of the position - time graph for each time interval:
- The slope of a position - time graph represents velocity. A steeper slope means higher velocity and a flatter slope means lower velocity.
- For the interval 0 - 6 seconds: The slope first increases (steeper) and then decreases (less steep), so the object speeds up and then slows down.
- For 6 - 10 seconds: The slope is non - zero and not the flattest compared to other intervals, so it's not the slowest.
- For 12 - 14 seconds: The slope is relatively steep, so it's not very slow.
- For 14 - 18 seconds: The position is increasing, so the object is moving away from the starting point, not towards it.
Answer:
From time 0 to 6, he went fast and then slowed down.