bonnies pool thermometer tracks the water temperature over the course of the day. on sunday, she noticed…
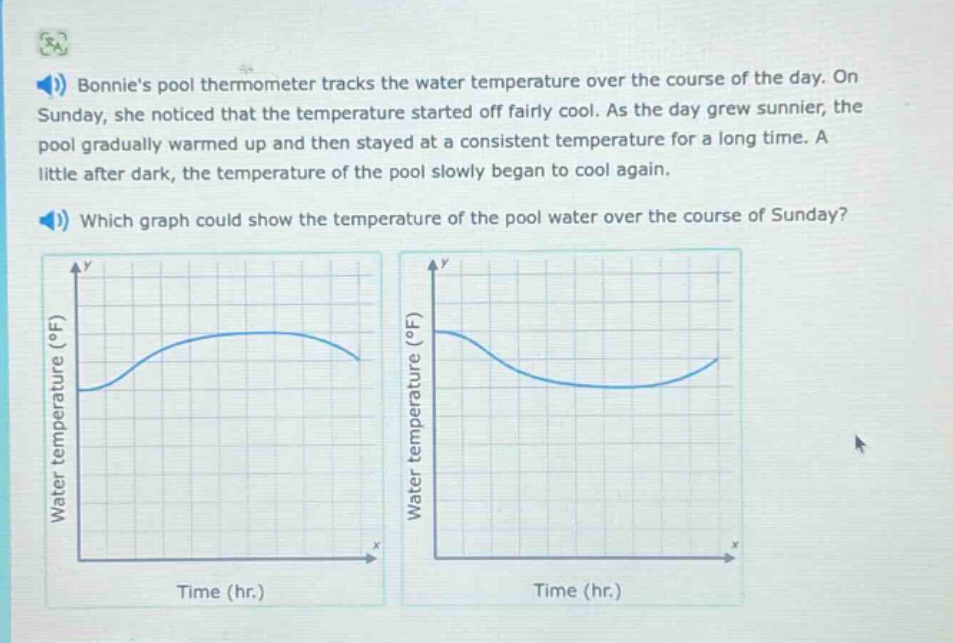
bonnies pool thermometer tracks the water temperature over the course of the day. on sunday, she noticed that the temperature started off fairly cool. as the day grew sunnier, the pool gradually warmed up and then stayed at a consistent temperature for a long time. a little after dark, the temperature of the pool slowly began to cool again. which graph could show the temperature of the pool water over the course of sunday?
Answer
Explanation:
Step1: Analizar el inicio
La temperatura empieza fría, así que en el eje de tiempo inicial (x = 0), la temperatura (y) debe ser baja.
Step2: Analizar el calentamiento
A medida que el día se hace más soleado, la temperatura aumenta. Entonces, la curva debe tener una pendiente positiva en un primer tramo.
Step3: Analizar la temperatura constante
Después, la temperatura se mantiene constante. Esto significa que la curva debe ser horizontal durante un tiempo.
Step4: Analizar el enfriamiento
Después del anochecer, la temperatura disminuye. La curva debe tener una pendiente negativa en este tramo.
Answer:
La gráfica de la izquierda muestra un inicio con temperatura baja, un aumento, una sección horizontal y luego un descenso, por lo que es la correcta.