charlotte is playing kickball with her friends. the ball rolls to her along the ground and she kicks it as…
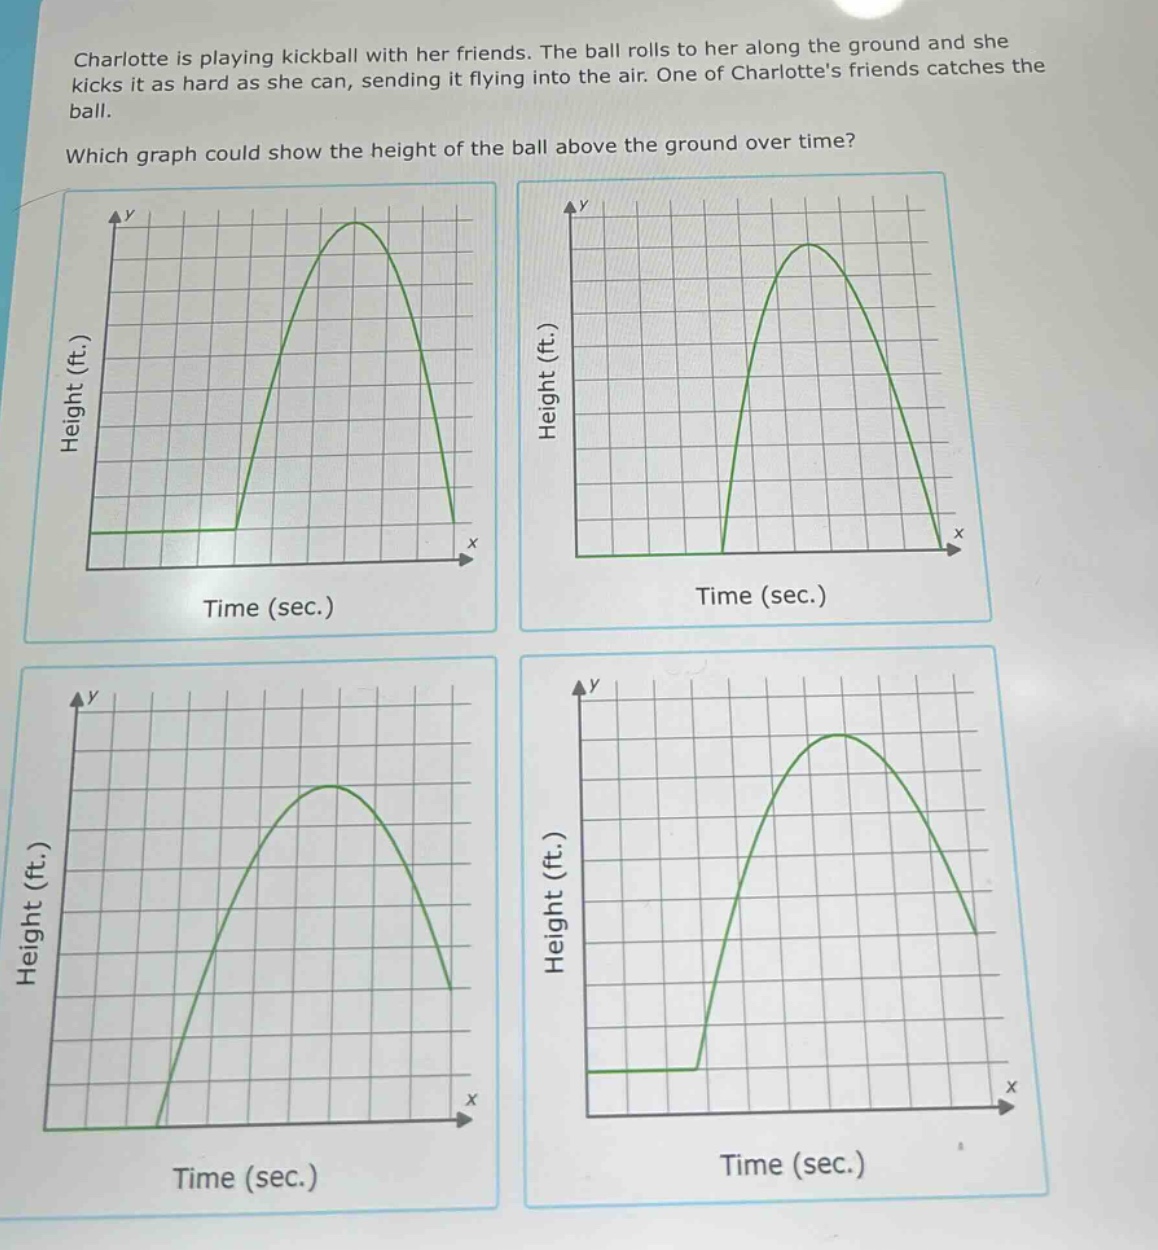
charlotte is playing kickball with her friends. the ball rolls to her along the ground and she kicks it as hard as she can, sending it flying into the air. one of charlottes friends catches the ball. which graph could show the height of the ball above the ground over time?
Answer
Explanation:
Step1: Analyze ball's motion
The ball starts on the ground, is kicked up, reaches a maximum height, then is caught before hitting the ground again.
Step2: Evaluate graph features
The height - time graph should start at ground level (height = 0), increase as the ball goes up, have a peak at the maximum height, and then decrease until it is caught (not reaching height = 0 again).
Answer:
The graph where the ball starts at height 0, goes up in a parabolic - like shape, reaches a peak, and then comes down but does not touch the ground again (the second graph from the left in the top row).