the chart shows data for a moving object. which conclusion is best supported by the information in the…
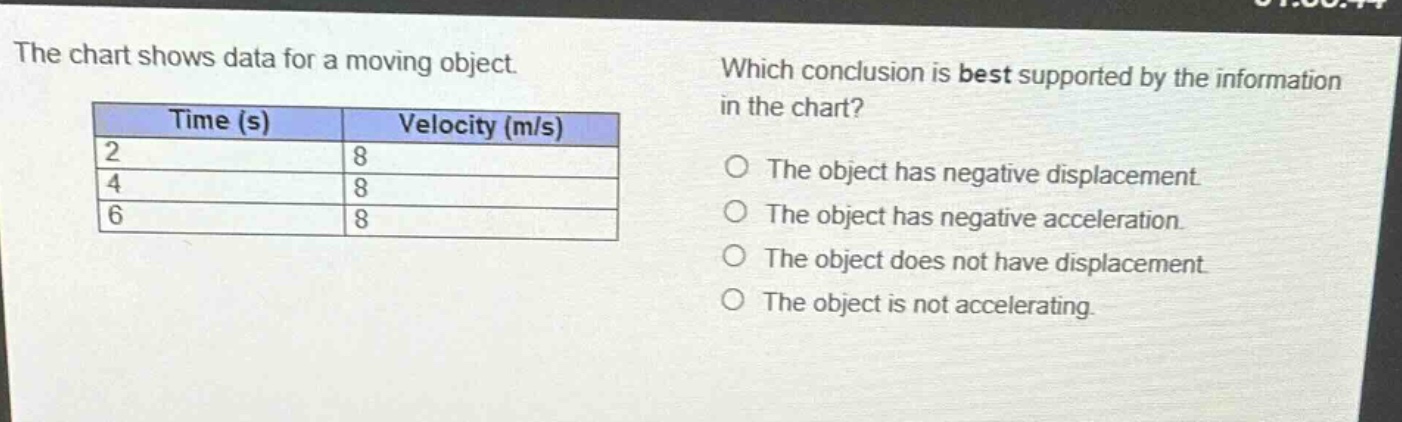
the chart shows data for a moving object. which conclusion is best supported by the information in the chart? time (s) velocity (m/s) 2 8 4 8 6 8 the object has negative displacement. the object has negative acceleration. the object does not have displacement. the object is not accelerating.
Answer
Explanation:
Step1: Recall acceleration formula
Acceleration $a=\frac{\Delta v}{\Delta t}$, where $\Delta v = v_f - v_i$ and $\Delta t=t_f - t_i$.
Step2: Analyze data
From the table, at $t = 2s$, $v = 8m/s$; at $t = 4s$, $v = 8m/s$; at $t = 6s$, $v = 8m/s$. So, $\Delta v=8 - 8=0$ for any time - interval considered.
Step3: Calculate acceleration
Since $\Delta v = 0$ for any non - zero $\Delta t$, then $a=\frac{0}{\Delta t}=0$.
Answer:
The object is not accelerating.