the chart shows data for an object moving at a constant acceleration. which values best complete the chart…
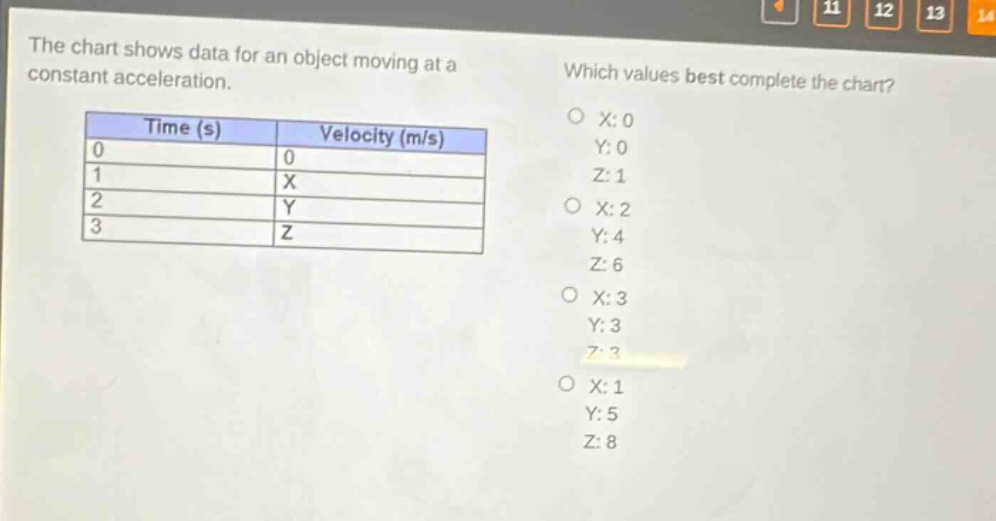
the chart shows data for an object moving at a constant acceleration. which values best complete the chart? time (s) velocity (m/s) 0 0 1 x 2 y 3 z x: 0 y: 0 z: 1 x: 2 y: 4 z: 6 x: 3 y: 3 z: 3 x: 1 y: 5 z: 8
Answer
Explanation:
Step1: Recall acceleration formula
The formula for acceleration $a=\frac{v - u}{t}$, where $v$ is final - velocity, $u$ is initial - velocity, and $t$ is time. Given the object has a constant acceleration and at $t = 0$, $u=0$. Let the acceleration be $a$.
Step2: Find velocity at $t = 1$
Using $v=u + at$, with $u = 0$, $t = 1$ and assuming acceleration $a = 2\ m/s^{2}$ (we can find this by checking the options). Then $v=0+2\times1 = 2\ m/s$, so $X = 2$.
Step3: Find velocity at $t = 2$
Using $v=u+at$, with $u = 0$, $t = 2$ and $a = 2\ m/s^{2}$, then $v=0 + 2\times2=4\ m/s$, so $Y = 4$.
Step4: Find velocity at $t = 3$
Using $v=u+at$, with $u = 0$, $t = 3$ and $a = 2\ m/s^{2}$, then $v=0+2\times3 = 6\ m/s$, so $Z = 6$.
Answer:
X: 2 Y: 4 Z: 6