click in the region of the graph that you would expect the next data point to be found if the number of…
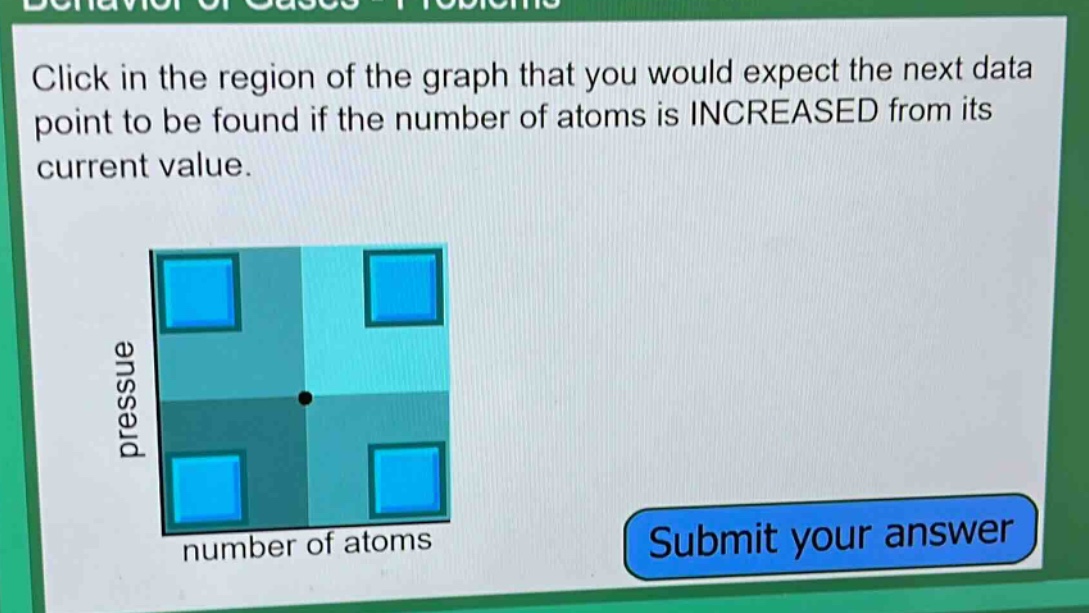
click in the region of the graph that you would expect the next data point to be found if the number of atoms is increased from its current value.\npressure\nnumber of atoms\nsubmit your answer
Answer
Explanation:
Step1: Understand gas - pressure relationship
According to the ideal gas law $PV = nRT$ (where $P$ is pressure, $V$ is volume, $n$ is the number of moles which is proportional to the number of atoms, $R$ is the gas constant and $T$ is temperature). Assuming volume and temperature are constant, pressure is directly proportional to the number of atoms ($P\propto n$).
Step2: Determine graph region
Since pressure is directly proportional to the number of atoms, when the number of atoms is increased, the pressure will increase. So, we should click in the region of the graph where the number of atoms is higher and the pressure is higher than the current data - point. This would be the upper - right region of the graph.
Answer:
The upper - right region of the graph.