complete the passage to describe velocity vs time graphs. a velocity vs time graph is a graph that shows the…
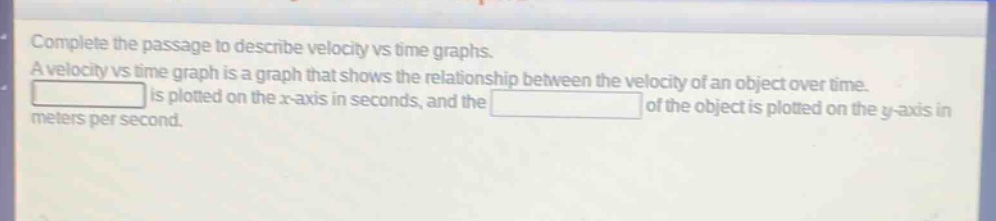
complete the passage to describe velocity vs time graphs. a velocity vs time graph is a graph that shows the relationship between the velocity of an object over time. blank is plotted on the x - axis in seconds, and the blank of the object is plotted on the y - axis in meters per second.
Answer
Brief Explanations:
In a velocity - time graph, time is on the x - axis as it is the independent variable and velocity is on the y - axis as it is the dependent variable that changes with time.
Answer:
Time; velocity