consider the temperature versus time graph below.\ntemperature vs. time\nat what temperature is the boiling…
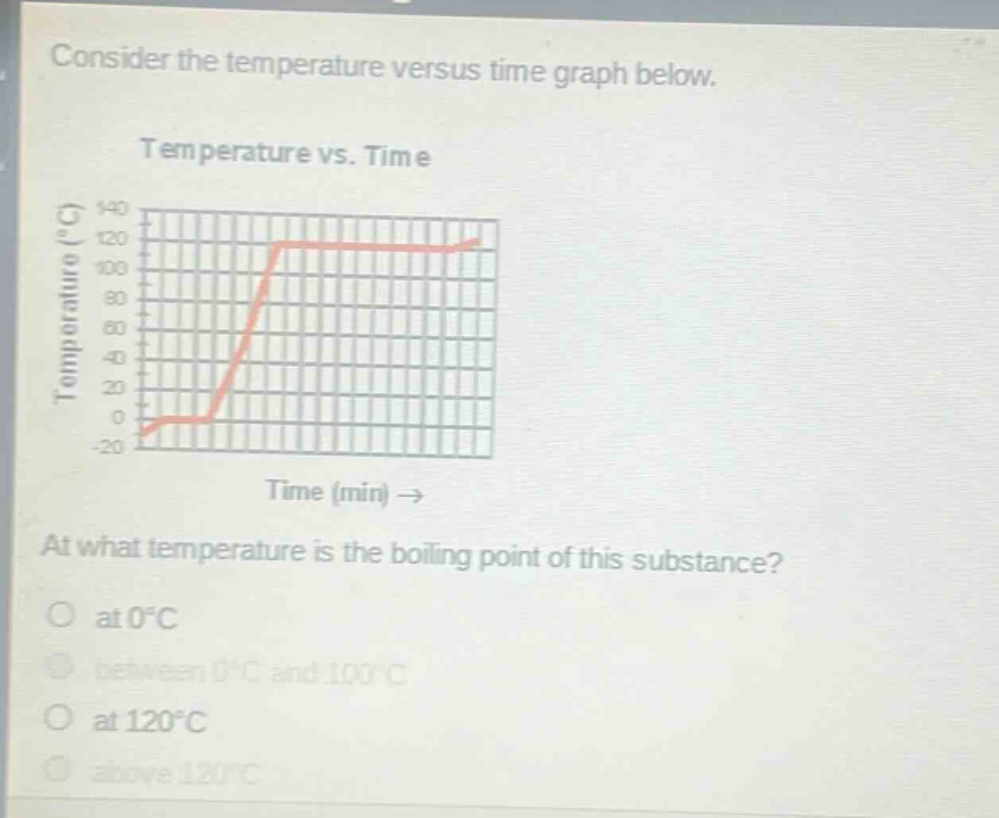
consider the temperature versus time graph below.\ntemperature vs. time\nat what temperature is the boiling point of this substance?\no at 0°c\no between 0°c and 100°c\no at 120°c\no above 120°c
Answer
Answer:
at 120°C
Explanation:
Step1: Analyze the temperature vs. time graph.
The graph shows how the temperature of a substance changes as heat is added over time.
Step2: Identify plateaus indicating phase changes.
The flat sections (plateaus) of the graph represent phase changes (melting or boiling), where the temperature remains constant despite adding heat.
Step3: Locate the boiling point plateau.
The second, higher temperature plateau corresponds to the boiling point, where the substance changes from liquid to gas.
Step4: Read the temperature at the boiling point plateau.
Looking at the y-axis, the temperature during the second plateau is constant at 120°C. Therefore, the boiling point is 120°C.