consider the temperature versus time graph below.\ntemperature vs. time\nat what temperature is the boiling…
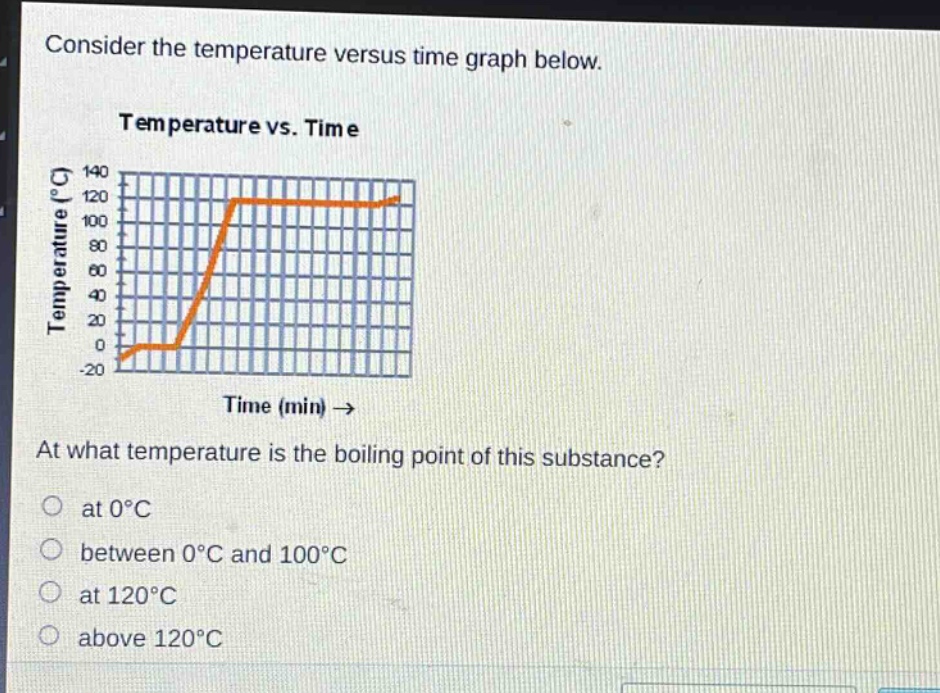
consider the temperature versus time graph below.\ntemperature vs. time\nat what temperature is the boiling point of this substance?\nat 0°c\nbetween 0°c and 100°c\nat 120°c\nabove 120°c
Answer
Brief Explanations:
The provided image shows a heating curve, plotting temperature against time for a substance as heat is added. The boiling point is the temperature at which the substance undergoes a phase transition from liquid to gas. During boiling, the temperature remains constant even as heat is added, which is represented by a horizontal plateau on the heating curve. Observing the graph, after the initial melting phase at 0°C and subsequent heating of the liquid phase, the temperature levels off at 120°C. This plateau indicates the boiling point of the substance.
Answer:
at 120°C