considering the temperature vs. time graph below, how does the temperature at the beginning of a change of…
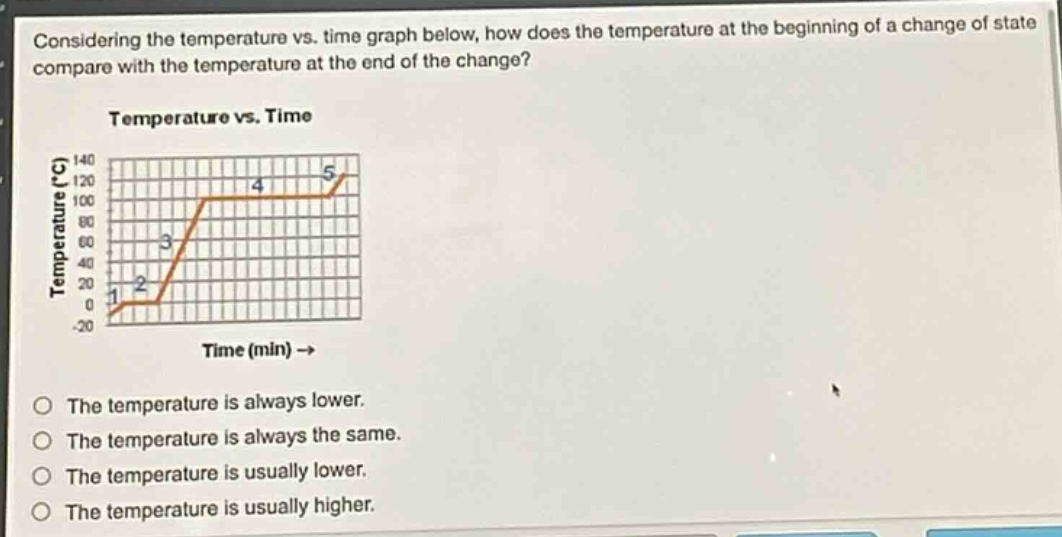
considering the temperature vs. time graph below, how does the temperature at the beginning of a change of state compare with the temperature at the end of the change?\ntemperature vs. time\nthe temperature is always lower.\nthe temperature is always the same.\nthe temperature is usually lower.\nthe temperature is usually higher.
Answer
Explanation:
Step1: Recall phase - change concept
During a phase - change (like melting or boiling), the temperature remains constant as heat is used for the phase - transition rather than increasing the temperature.
Step2: Analyze the graph
In the graph, the horizontal sections (2 and 4) represent phase - changes. At the start and end of these horizontal sections (phase - changes), the temperature values are the same.
Answer:
The temperature is always the same.