considering the temperature vs. time graph below, how does the temperature at the beginning of a change of…
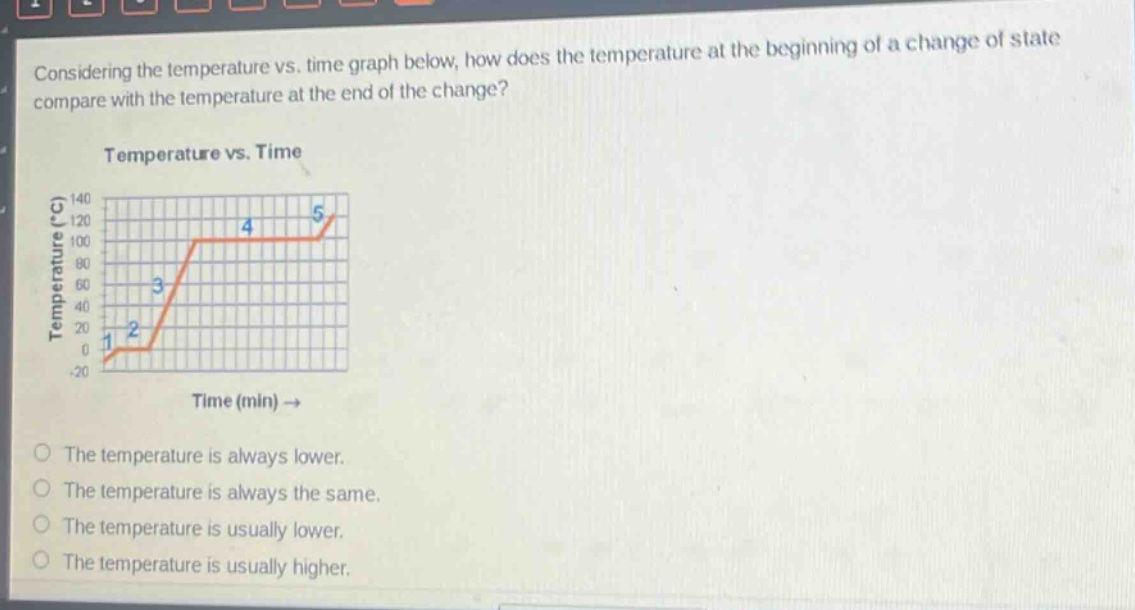
considering the temperature vs. time graph below, how does the temperature at the beginning of a change of state compare with the temperature at the end of the change? temperature vs. time temperature (°c) 140 120 100 80 60 40 20 0 -20 1 2 3 4 5 time (min) → the temperature is always lower. the temperature is always the same. the temperature is usually lower. the temperature is usually higher.
Answer
Answer:
B. The temperature is always the same.
Explanation:
Step1: Identify change - of - state regions
Regions 2 and 4 are change - of - state regions.
Step2: Observe temperature values
In region 2 (melting), temperature is constant. In region 4 (boiling), temperature is constant.
Step3: Compare start and end
For any change - of - state process shown, temperature at start = temperature at end.