7. the data shown in the table were collected during an evaporation experiment. which statement best…
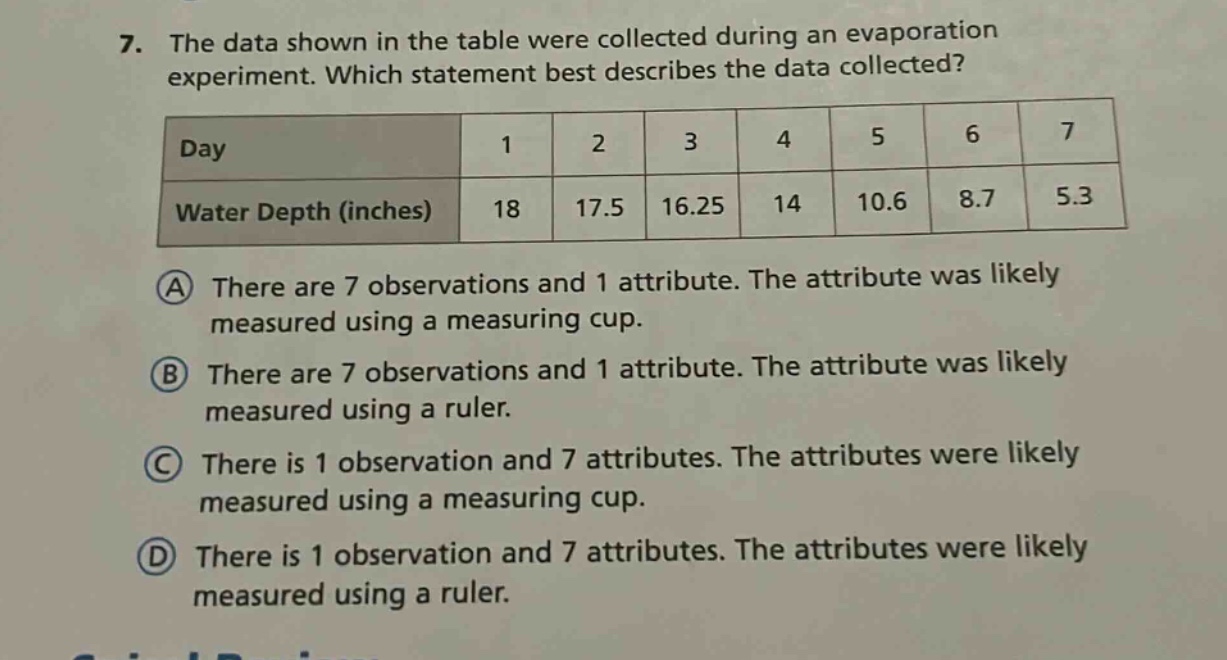
7. the data shown in the table were collected during an evaporation experiment. which statement best describes the data collected? day 1 2 3 4 5 6 7 water depth (inches) 18 17.5 16.25 14 10.6 8.7 5.3 a there are 7 observations and 1 attribute. the attribute was likely measured using a measuring cup. b there are 7 observations and 1 attribute. the attribute was likely measured using a ruler. c there is 1 observation and 7 attributes. the attributes were likely measured using a measuring cup. d there is 1 observation and 7 attributes. the attributes were likely measured using a ruler.
Answer
Brief Explanations:
Each row in the table represents an observation (7 days of data collection). The water - depth is the single attribute being measured. Since water - depth is a linear measurement of length, it is likely measured using a ruler.
Answer:
B. There are 7 observations and 1 attribute. The attribute was likely measured using a ruler.