a designer at a car company is testing new electric motors. the position of the car on the track as a…
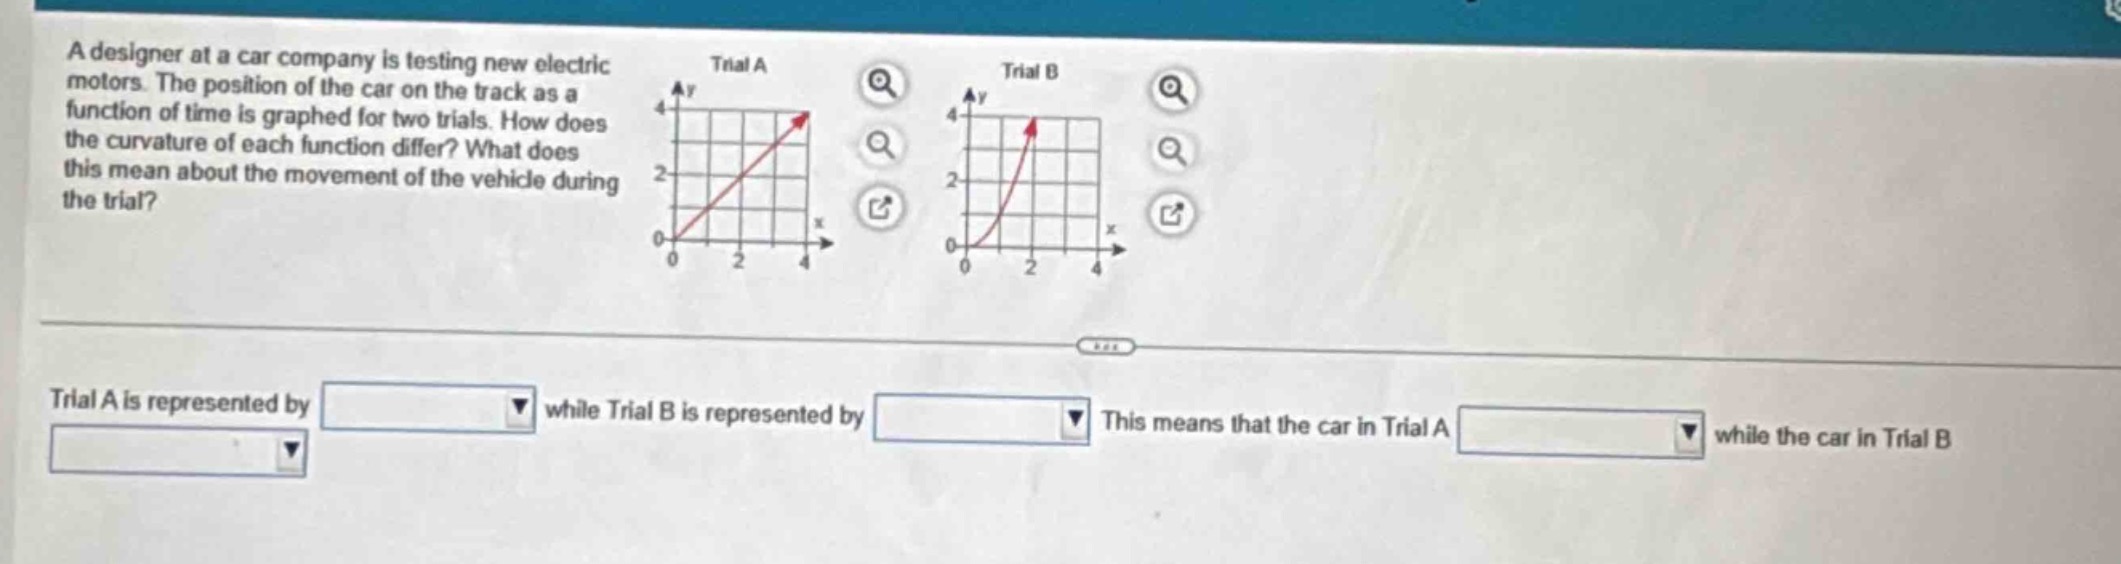
a designer at a car company is testing new electric motors. the position of the car on the track as a function of time is graphed for two trials. how does the curvature of each function differ? what does this mean about the movement of the vehicle during the trial? trial a is represented by while trial b is represented by this means that the car in trial a while the car in trial b
Answer
Explanation:
Step1: Analyze Trial A graph
The graph of Trial A is a straight - line. In a position - time graph, a straight - line indicates a constant velocity. The slope of the line is constant, so the curvature is 0.
Step2: Analyze Trial B graph
The graph of Trial B is a curved line. In a position - time graph, a curved line indicates a non - constant velocity, which means there is an acceleration. The curvature is non - zero.
Step3: Interpret the motion
For Trial A, since the curvature is 0 and the graph is a straight line, the car is moving with a constant speed (uniform motion). For Trial B, since the graph is curved, the car is accelerating (non - uniform motion).
Answer:
Trial A is represented by a straight - line function while Trial B is represented by a curved function. This means that the car in Trial A is moving with a constant speed while the car in Trial B is accelerating.